On this page
Slot Machine Appendix 3E
Relationship between Coinage and Return for Las Vegas Slot Machines
Many readers have read my Appendix 3A and asked about higher coinages. Until May 2002 I have resisted publishing my results because of an insufficient sample size. However I have been asked so many times that I'll give you what I've got. First let me say that my emphasis is still nickel slots. The vast majority of video display slots that I test are nickel games. Remember, you can play roughly 100 coins at a time, or up to $5 per spin. So there isn't much need to bet more than that unless the player has a very large bankroll. As of this writing I have only seen quarter video display slots in 16 Las Vegas casinos and dollar slots in 8. Even those that had them did not have a large selection.
The following table lists all casinos in which I found at least one quarter or dollar video display slot machine. The table shows the nickel, quarter, and dollar returns, sorted by nickel return. You will notice some casinos actually go down slightly from nickels to quarters. This is due to sampling variation. Some types of machines tend to paybetter than others, and those at the quarter level tend to be the stingier varieties. The nickel returns listed here may not agree with those in Appendix 3A. That is because Appendix 3a reflects some updated results and this appendix does not.
Return by Coinage for Las Vegas Slots
| Casino | Nickel | Quarter | Dollar |
|---|---|---|---|
|
Palms |
93.42% |
94.97% |
|
|
Rampart Casino in Summerlin |
93.13% |
94.96% |
|
|
Circus Circus |
92.56% |
94.01% |
|
|
Arizona Charlie's |
92.49% |
|
92.76% |
|
Riviera |
92.23% |
92.76% |
|
|
Excalibur |
91.84% |
|
92.17% |
|
Texas Station |
91.71% |
92.53% |
|
|
Casino Royale |
91.67% |
94.49% |
94.97% |
|
Aladdin |
91.50% |
92.64% |
94.97% |
|
Santa Fe Station |
90.87% |
94.47% |
96.23% |
|
Flamingo |
90.86% |
92.50% |
94.96% |
|
Tropicana |
90.71% |
90.12% |
|
|
New York New York |
90.57% |
89.78% |
|
|
Main Street Station |
90.56% |
90.05% |
|
|
Caesars Palace |
89.57% |
90.44% |
92.53% |
|
Harrahs |
89.32% |
92.76% |
|
|
Treasure Island |
89.32% |
90.04% |
|
|
Mirage |
89.07% |
88.29% |
92.17% |
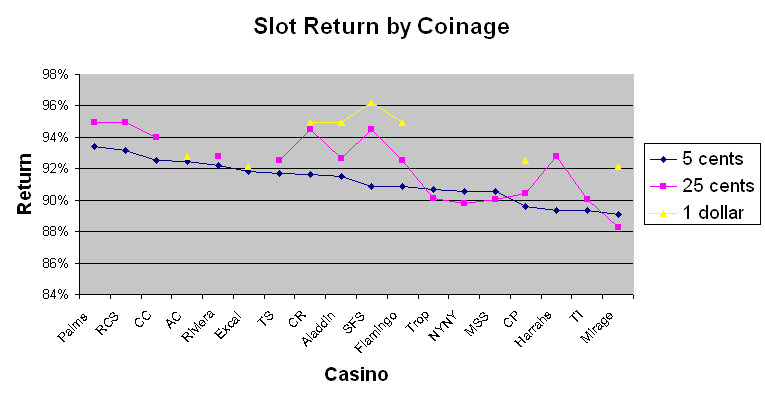
The following chart shows the return for each coinage ateach casino. This chart seem to support a general correlation between nickel and quarter return, although itis not a strong correlation. There is also a rough correlation between quarters and dollars, with Arizona Charlie's and the Excalibur as exceptions.

Casino name abbreviations:
RCS = Rampart Casino in Summerlin
CC = Circus Circus
AC = Arizona Charlie's
Excal = Excalibur
TS = Texas Station
CR = Casino Royale
SFS = Santa Fe Station
Trop = Tropicana
NYNY = New York New York
MSS = Main Street Station
CP = Caesars Palace
TI = Treasure Island
Acknowledgements: I would like to thank Par SheetPete (not his real name) for providing the par sheets, without which this project would not have been possible. I would also like to thank Rob Feldheim for helping to collect data for this survey.
Internal Links
- Appendix 1 shows the details and analysis of almost 4000 actual spins on a Reno slot machine.
- Appendix 2 shows an example of the virtual reels behind a hypothetical slot machine and how the average return is calculated.
- Appendix 3A: 2003 Las Vegas slot machine rankings.
- Appendix 3B: 2002 Jean/Primm slot machine rankings.
- Appendix 3C: 2002 Tunica slot machine rankings.
- Appendix 3D: 2002 Henderson/Lake Mead slot machine rankings.
- Appendix 3E: 2002 Quarter and dollar returns for Las Vegas slots
- Appendix 4 shows how the return is calculated for my Wizard's Fruit Slot Machine.
- Appendix 5 analysis of the 21 Bell Slot Machine.
- Appendix 6 Analysis of Red, White, & Blue Slot Machine.
- Lock and Roll analysis of the skill-based slot machine found in North Carolina.
- Deconstructing Megabucks.
- Baltimore Sun article, in which I am quoted.


