Wizard Recommends
-
 $11000 Welcome Bonus
 -
 $3000 Welcome Bonus
 -
 UP TO $777 BONUS
On this page
Deconstructing Jackpot Party
Introduction
Historically, slot machines have been one of the few casino games that were nearly impossible to analyze without inside information about how an individual game was programmed. Every other casino game is open about its rules so the odds are quantifiable. However, with slots, the player is at the mercy of unknown reel strips. The casino doesn't tell the player the distribution of symbols on the strips, nor how they are weighted for single-line slots. While that doesn't seem to bother most players, it bothers me.

In an effort to break this wall of secrecy, I recorded 212 spins of the game Jackpot Party on my cell phone. Then I went home and hand entered every outcome into a spreadsheet. Finally, I did the math to determine what I was up against. This page shows what I found.
Step One - Data Collection
I decided to study the game Jackpot Party because it is a simple design and typical of the way video slot machines work. The game is somewhat outdated as I write this, but I managed to find a "classic" penny version at the Wynn on January 24, 2012. Armed with a cell phone camera, I played as fast as possible for eight minutes. I broke for lunch then returned to record another 10 minutes of play. The videos of my play can be found on YouTube:
Jackpot Party part 1
Jackpot Party part 2
When I returned home, I hired my brother in law to record, by hand, the three visible symbols on each reel for all 212 bets in the first video. It turned out that video was enough, and I didn't need the second one.
Step Two - The Reel Strips
To make a long story short, I found that there were only so many different combinations of three symbols on each reel, just as I suspected. To be specific, from the first video I noticed the following number of patterns for reach reel:
- Reel 1: 26
- Reel 2: 28 (one of these patterns occurs twice, so 29 total positions on the reel strip)
- Reel 3: 26
- Reel 4: 29
- Reel 5: 26
The 212 spins in the first video were enough to ensure I saw every combination at least once. If I found there was a missing segment in the reel strips, I still had the second video to fall back on, but I never needed it.
The next step was like a jigsaw puzzle. I had to find how the different sequences of three symbols overlapped to form a complete reel. It took a few hours, but I eventually figured it out. A tricky part was that in reel 2 one sequence (blue 7-plum-orange) appears in two separate places.
The following table shows the result of many hours of labor, the complete reel stripping for Jackpot Party.
Jackpot Party Reel Strips
| Position | Reel 1 | Reel 2 | Reel 3 | Reel 4 | Reel 5 |
|---|---|---|---|---|---|
| 1 | Cherry | Orange | Bell | Bell | Watermelon |
| 2 | Wild Fruit | Bell | Cherry | Orange | Cherry |
| 3 | Green 7 | Plum | Jackpot 7 | Jackpot 7 | Orange |
| 4 | Plum | Green 7 | Watermelon | Wild Fruit | Bell |
| 5 | Cherry | Watermelon | Plum | Orange | Cherry |
| 6 | Blue 7 | Orange | Cherry | Watermelon | Plum |
| 7 | Plum | Blue 7 | Green 7 | Cherry | Blue 7 |
| 8 | Party | Plum | Orange | Blue 7 | Orange |
| 9 | Green 7 | Orange | Bell | Orange | Bell |
| 10 | Orange | Watermelon | Plum | Watermelon | Plum |
| 11 | Cherry | Jackpot 7 | Watermelon | Plum | Party |
| 12 | Blue 7 | Wild Fruit | Bell | Green 7 | Green 7 |
| 13 | Bell | Plum | Orange | Cherry | Cherry |
| 14 | Party | Orange | Cherry | Bell | Orange |
| 15 | Plum | Blue 7 | Party | Green 7 | Blue 7 |
| 16 | Watermelon | Cherry | Bell | Plum | Party |
| 17 | Jackpot 7 | Orange | Blue 7 | Bell | Watermelon |
| 18 | Orange | Bell | Cherry | Orange | Cherry |
| 19 | Cherry | Jackpot 7 | Wild Fruit | Plum | Blue 7 |
| 20 | Wild Fruit | Cherry | Orange | Blue 7 | Watermelon |
| 21 | Watermelon | Bell | Watermelon | Cherry | Orange |
| 22 | Orange | Plum | Bell | Watermelon | Bell |
| 23 | Plum | Cherry | Cherry | Jackpot 7 | Green 7 |
| 24 | Cherry | Green 7 | Party | Plum | Plum |
| 25 | Bell | Orange | Watermelon | Watermelon | Wild Fruit |
| 26 | Green 7 | Bell | Orange | Bell | Jackpot 7 |
| 27 | Watermelon | Blue 7 | |||
| 28 | Blue 7 | Plum | |||
| 29 | Plum | Cherry |
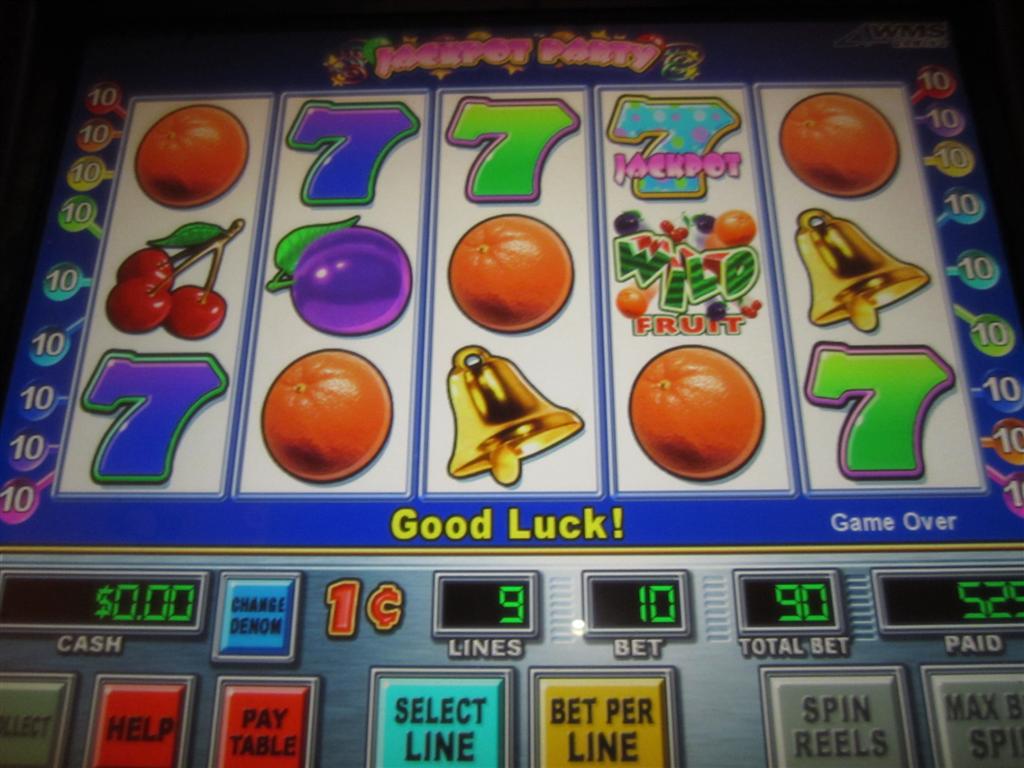
The way multi-line video slots work is they draw random numbers, one for each reel, to determine where on the reel strips to stop. In this case, the game would choose three random integers from 1 to 26 for reels 1, 3 and 5, and two random integers from 1 to 29 for reels 2 and 4. It would then map these random numbers to a position on on the reels.
For example, if the game chose the numbers 10,7,7,3,21 for reels 1 to 5 respectively, and mapped them to the position on the reels on the top row on the screen, then the screen would look like this:
The next table shows the total number of each symbol on each reel.
Jackpot Party Symbol Distribution
| Symbol | Reel 1 | Reel 2 | Reel 3 | Reel 4 | Reel 5 |
|---|---|---|---|---|---|
| Jackpot 7 | 1 | 2 | 1 | 2 | 1 |
| Green 7 | 3 | 2 | 1 | 2 | 2 |
| Blue 7 | 2 | 3 | 1 | 3 | 3 |
| Bell | 2 | 4 | 5 | 4 | 3 |
| Wild Fruit | 2 | 1 | 1 | 1 | 1 |
| Watermelon | 2 | 3 | 4 | 4 | 3 |
| Plum | 4 | 5 | 2 | 5 | 3 |
| Orange | 3 | 6 | 4 | 4 | 4 |
| Cherry | 5 | 3 | 5 | 4 | 4 |
| Party | 2 | 0 | 2 | 0 | 2 |
| Total | 26 | 29 | 26 | 29 | 26 |
Step Three - The Pay Table
The pay table is easily seen from the rule screens. That is why the first video shows me running through it. There are three types of symbols: the 7s, the fruits, and the bonus. Three to five of the the same colored 7 symbol is a win. In addition, three to five mixed 7 symbols is a lesser win. There are also wins for three to five fruits, but no win for mixed fruits. However, there is a "wild fruit" symbol, which can substitute for any fruit. The player is also paid for 1 to 5 wild fruit symbols. All sevens and fruit wins are left aligned, meaning that all wins start with the left-most reel. The player is paid the highest award per line.
Following is the complete pay table.
Jackpot Party Pay Table
| Symbol | 5 pays | 4 pays | 3 pays | 2 pays | 1 pays |
|---|---|---|---|---|---|
| Jackpot 7 | 5000 | 100 | 40 | ||
| Green 7 | 250 | 50 | 25 | ||
| Blue 7 | 200 | 50 | 20 | ||
| Mixed 7 | 100 | 40 | 5 | ||
| Bell | 200 | 50 | 20 | ||
| Wild Fruit | 2000 | 50 | 10 | 5 | 2 |
| Watermelon | 150 | 25 | 10 | ||
| Plum | 150 | 25 | 10 | ||
| Orange | 50 | 10 | 5 | ||
| Cherry | 50 | 10 | 5 |
Step Four - Line Pay Math
The next table shows the number of combinations for each possible win. If you tried to replicate this table it may not come out the same, because some wins can be scored equally two different ways. For example, wild fruit-wild fruit-cherry-blue 7-watermelon wins 5 for either two wild fruit or three cherries. Cells are left blank if they don't produce a win.
The wild symbol and mixed seven wins make a mathematical analysis of line pay wins tedious, complicated, and error prone. In my strong opinion, the safest and easiest way to analyze the line pay wins is to score every possible outcome with five nested loops.
The lower right cell shows the total winning combinations is 1,516,294. There are 26×29×26×29×26 = 14,781,416 total possible combinations in Jackpot Party. That makes the hit frequency per line 1,516,294/14,781,416 = 10.258%. In other words, the probability the player will win something on any given line is 10.3%.
Jackpot Party Line Pay Combinations
| Symbol | 5 | 4 | 3 | 2 | 1 | Total |
|---|---|---|---|---|---|---|
| Jackpot 7 | 4 | 80 | 1,144 | 1,228 | ||
| Green 7 | 24 | 240 | 3,432 | 3,696 | ||
| Blue 7 | 54 | 360 | 3,432 | 3,846 | ||
| Bell | 480 | 3,680 | 26,000 | 30,160 | ||
| Wild Fruit | 2 | 22 | 572 | 15,080 | 980,200 | 995,876 |
| Watermelon | 1,598 | 8,756 | 48,672 | 59,026 | ||
| Plum | 2,590 | 14,212 | 63,388 | 80,190 | ||
| Orange | 4,373 | 18,333 | 107,952 | 130,658 | ||
| Cherry | 4,198 | 17,598 | 103,584 | 125,380 | ||
| Mixed 7 | 5,210 | 16,960 | 64,064 | 86,234 | ||
| Total | 18,533 | 80,241 | 422,240 | 15,080 | 980,200 | 1,516,294 |
The next table shows the probability of each possible win. This is simply the number of combinations in each cell above divided by the total number of combinations of 14,781,416.
Jackpot Party Line Pay Probabilities
| Symbol | 5 | 4 | 3 | 2 | 1 | Total |
|---|---|---|---|---|---|---|
| Jackpot 7 | 0.00000027 | 0.00000541 | 0.00007739 | 0.00008308 | ||
| Green 7 | 0.00000162 | 0.00001624 | 0.00023218 | 0.00025004 | ||
| Blue 7 | 0.00000365 | 0.00002435 | 0.00023218 | 0.00026019 | ||
| Bell | 0.00003247 | 0.00024896 | 0.00175897 | 0.00204040 | ||
| Wild Fruit | 0.00000014 | 0.00000149 | 0.00003870 | 0.00102020 | 0.06631300 | 0.06737352 |
| Watermelon | 0.00010811 | 0.00059237 | 0.00329278 | 0.00399326 | ||
| Plum | 0.00017522 | 0.00096148 | 0.00428836 | 0.00542506 | ||
| Orange | 0.00029584 | 0.00124027 | 0.00730322 | 0.00883934 | ||
| Cherry | 0.00028401 | 0.00119055 | 0.00700772 | 0.00848227 | ||
| Mixed 7 | 0.00035247 | 0.00114739 | 0.00433409 | 0.00583395 | ||
| Total | 0.00125380 | 0.00542851 | 0.02856560 | 0.00102020 | 0.06631300 | 0.10258111 |
The next table shows the product of each winning probability and what it pays. The lower right cell shows that the player can expect to win 59.60% of his bet per spin from line pays.
Jackpot Party Line Pay Returns
| Symbol | 5 | 4 | 3 | 2 | 1 | Total |
|---|---|---|---|---|---|---|
| Jackpot 7 | 0.00135305 | 0.00054122 | 0.00309578 | 0.00499005 | ||
| Green 7 | 0.00040592 | 0.00081183 | 0.00580459 | 0.00702233 | ||
| Blue 7 | 0.00073065 | 0.00121775 | 0.00464367 | 0.00659206 | ||
| Bell | 0.00649464 | 0.01244806 | 0.03517931 | 0.05412201 | ||
| Wild Fruit | 0.00027061 | 0.00007442 | 0.00038697 | 0.00510100 | 0.13262599 | 0.13845899 |
| Watermelon | 0.01621631 | 0.01480914 | 0.03292783 | 0.06395328 | ||
| Plum | 0.02628300 | 0.02403694 | 0.04288358 | 0.09320352 | ||
| Orange | 0.01479222 | 0.01240274 | 0.03651612 | 0.06371108 | ||
| Cherry | 0.01420026 | 0.01190549 | 0.03503859 | 0.06114435 | ||
| Mixed 7 | 0.03524696 | 0.04589547 | 0.02167045 | 0.10281288 | ||
| Total | 0.11599362 | 0.12414305 | 0.21814689 | 0.00510100 | 0.13262599 | 0.59601056 |
Step Five - The Bonus
There are two "party" symbols on reels 1, 3, and 5. If the player gets one on all three reels, then he will play the bonus. Note that the party symbols don't need to be on the same line. It is scored as a "scatter" symbol, meaning it can be anywhere to get credit for it.
You can see an example of a bonus round at the 3:20 point in the first video.
In the bonus round there are 30 gifts. The player will keep picking gifts and accumulating the money inside them until he selects a "Party Pooper." There are six Party Poopers. Even the Party Poopers have a minimum win of 1. The following table shows how all the prizes are distributed. All prizes are relative to the total amount bet on the initiating spin.
Jackpot Party Prizes
| Prize | Number |
|---|---|
| 1 | 2 |
| 2 | 5 |
| 3 | 1 |
| 4 | 1 |
| 5 | 9 |
| 10 | 3 |
| 15 | 2 |
| 20 | 1 |
| Party Pooper + 1 | 6 |
| Total | 30 |
The next table shows the probability of 0 to 25 picks in the bonus round, including the bonus ending Party Pooper pick. The probability of exactly n picks is permut(24,n-1)×6/permut(30,n), which is the number of ways to pick n-1 successful picks out of 24, times the 6 ways to pick the Party Pooper, divided by the number of ways to pick n items out of 30.
The right column shows the product of the probability and number of picks. The lower right cell is sum of the expected number of picks, which shows the average number of picks is 4.428571.
Number Picks in Bonus
| Picks | Probability | Expected |
|---|---|---|
| 1 | 0.200000 | 0.200000 |
| 2 | 0.165517 | 0.331034 |
| 3 | 0.135961 | 0.407882 |
| 4 | 0.110783 | 0.443131 |
| 5 | 0.089478 | 0.447392 |
| 6 | 0.071583 | 0.429496 |
| 7 | 0.056670 | 0.396687 |
| 8 | 0.044350 | 0.354801 |
| 9 | 0.034271 | 0.308435 |
| 10 | 0.026111 | 0.261109 |
| 11 | 0.019583 | 0.215415 |
| 12 | 0.014430 | 0.173156 |
| 13 | 0.010421 | 0.135479 |
| 14 | 0.007356 | 0.102989 |
| 15 | 0.005057 | 0.075862 |
| 16 | 0.003372 | 0.053946 |
| 17 | 0.002167 | 0.036847 |
| 18 | 0.001334 | 0.024009 |
| 19 | 0.000778 | 0.014783 |
| 20 | 0.000424 | 0.008488 |
| 21 | 0.000212 | 0.004456 |
| 22 | 0.000094 | 0.002075 |
| 23 | 0.000035 | 0.000813 |
| 24 | 0.000010 | 0.000243 |
| 25 | 0.000002 | 0.000042 |
| Total | 1.000000 | 4.428571 |
By the way, a handy formula for the expected number of picks for the general case of n total icons and p Party Poopers is (n+1)/(p+1). In this case it would be (30+1)/(6+1) = 4.428571.
The total prize money in the bonus is 150. Of that 150, 6 is accompanied with Party Poopers, so 144 of it is what I would call safe money. There are 30-6=24 safe picks. So the average safe pick award is 144/24=6.
As shown above, the average number of total picks is 4.428571. However, one of those is the Party Pooper, so there would be 3.428571 safe picks, on average.
So, the average win before the Party Pooper would be (average win)*(number safe picks) = 6 × 3.428571 = 20.571429. Then add 1 for the Party Pooper consolation prize and the average bonus win is 21.571429.
The bonus is triggered if the player gets the Party symbol anywhere on reels 1, 3, and 5. There are 26 symbols on each of those reels. There are two Party symbols on each odd-numbered reel and three positions visible on each reel. So the probability of a Party symbol on any odd-numbered reel is 2×3/26 = 23.08%. The probability of getting the Party symbol on all three reels is (6/26)3 = 0.0122895, or 1 in 81.4.
The bonus return is (bonus probability)×(average bonus win) = 0.0122895 × 21.571429 = 0.265102.
Step Six — Summary
I've shown that the player can expect to win 59.601% of his bet from line pays and 26.510% from the bonus. Taking the sum, the total return for the game is 86.111%. In other words, the house edge is 13.889%.
An 86% return is pretty low for a slot machine. However, it doesn't come as a surprise to me. This is a penny game in a luxury casino, which both work against a high return. This does not mean that Jackpot Party is always set to 86%. The slot maker, WMS, would have other versions available, letting the slot director choose which program chip, known as an EPROM, to put into the machine.
The purpose of this page was not to embarrass anybody but to show an actual example of how a slot machine works.
More Deconstructions
I have deconstructed lots of slot machines. Here is a list of them:
- Deconstructing Jackpot Party analysis of the video slot machine.
- Deconstructing Lion's Share analysis of the classic MGM progressive game.
- Deconstructing Cleopatra analysis of the popular IGT game.
- Deconstructing Lionfish analysis of the slot game found on many Game Maker machines.
- Deconstructing Megabucks.
- Deconstructing the Atkins Diet slot machine.
- Deconstructing Lucky Larry's Lobstermania.
- Deconstructing Hexbreaker.
- Deconstructing Blazing Sevens.
- Deconstructing Hot Roll.