On this page
Organic Roulette Experiment
Introduction
In September 2016, I heard an accusation that Organic Roulette machines, made by Interblock, were taking aggressive countermeasures against wheel-clocking players. As an advocate of fair and honest gambling, the topic commanded my attention. Over six months, I attended many meetings on the topic and collected thousands of spins of data. This page tells the story of the investigation.
The Game
The Organic Roulette machine can be found in many Las Vegas casinos. It works the same way as the table game. The player has about 30 seconds to make a bet. Usually, the ball will shoot out while the player has 1 to 5 seconds left to bet. After betting is closed, it will still take several more seconds for the ball to land. Then winning bets will be paid and the whole process will repeat. It takes a little over one minute from beginning to end.
The Allegation
Beating the game is possible if there is enough time between the release of the ball and betting being closed. The ball and wheel speeds can be analyzed before the bets are closed. Wheel clockers can estimate the speed of the ball, wheel, and wheel position at the time of launch to estimate where on the wheel the ball will land.
I will refer to the player who brought this issue to my attention as Mr. S. According to him, recreational players would probably have received a fair game, where the chance of each number winning was 1 in 38. However, if certain red flags were raised, the game would enter what he referred to as "threatened mode." Red flags for a wheel clocker were hypothesized to be:
- Large bets. It was unclear how big "large" had to be, but $20 in total was deemed to be enough.
- Late bets. To be specific, the five seconds between the ball launch and the window of time closing.
- Section bets. Betting single numbers in close proximity on the wheel.
In the event the game felt threatened, the machine would allegedly take aggressive counter-measures. The goal of the counter measures was to influence the ball to land away from the section bet by the wheel clocker. How this was done was unclear but Mr. S had some theories, which he asked me not to share.
Mr. S shared his data with me and his analysis of it, which was definitely enough to whet my appetite. However, Mr. S asked that I not share any specifics about it.
Global Gaming Expo
In the early stages of my involvement with this, I attended the 2016 Global Gaming Expo in Las Vegas. Interblock had a very large and prominent location there. With the blessing of Mr. S, I asked to speak with an engineer at the Interblock booth. The saleswoman I initially interacted with found one who came over and introduced himself. I was seated at a similar machine to Organic Roulette that also allowed about five seconds after the ball launch to let the player finish making bets. After the introductions, the conversation went like this, and I'm paraphrasing:
- Shackleford: I notice on this machine that the ball is released several seconds before betting is cut off.
- Interblock: And?
- Shackleford: Don't you think it would be vulnerable to wheel-clocking teams?
- Interblock: We are well aware of that issue.
His body language and tone suggested he was going to say no more, so I thanked him for his time and went on my merry way.
Make of that conversation what you will.
First Experiment
After receiving a presentation by Mr. S, I was definitely curious about what was going on. As a first step, I gathered 299 spins of data along with another interested party I'll refer to as Mr. C. Our method of betting was to bet $2 each on five consecutive numbers. Mr. S was unsure if $10 in total bets would be enough for the game to feel threatened, but felt it was a good balance between angering the game and not losing too much money as we conducted the experiment.
Neither Mr. C nor I are wheel clockers, so we bet in a systematic way in which the center of the arc bet would be the winning number two spins back. The goal was to see how the winning position on the wheel compared with the center of our betting arc.
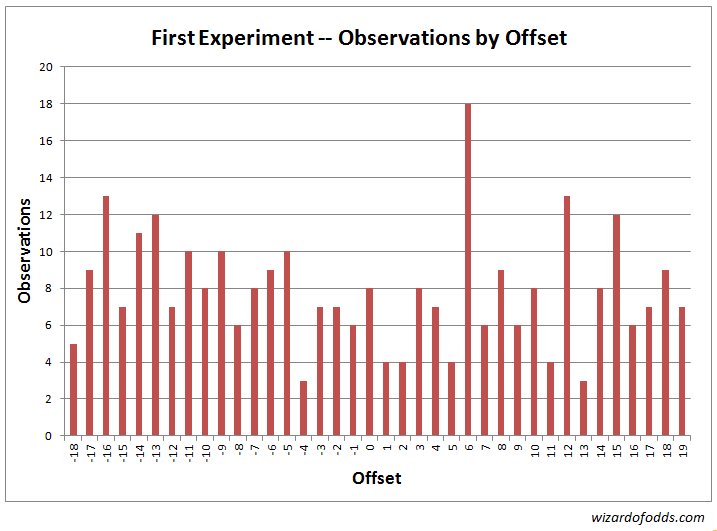
Graph 1 and Table 1 show the frequency of each offset between the position of our center betting position and the winning number.

Table 1
| Offset | Observations | Expectations |
|---|---|---|
| -18 | 5 | 7.87 |
| -17 | 9 | 7.87 |
| -16 | 13 | 7.87 |
| -15 | 7 | 7.87 |
| -14 | 11 | 7.87 |
| -13 | 12 | 7.87 |
| -12 | 7 | 7.87 |
| -11 | 10 | 7.87 |
| -10 | 8 | 7.87 |
| -9 | 10 | 7.87 |
| -8 | 6 | 7.87 |
| -7 | 8 | 7.87 |
| -6 | 9 | 7.87 |
| -5 | 10 | 7.87 |
| -4 | 3 | 7.87 |
| -3 | 7 | 7.87 |
| -2 | 7 | 7.87 |
| -1 | 6 | 7.87 |
| 0 | 8 | 7.87 |
| 1 | 4 | 7.87 |
| 2 | 4 | 7.87 |
| 3 | 8 | 7.87 |
| 4 | 7 | 7.87 |
| 5 | 4 | 7.87 |
| 6 | 18 | 7.87 |
| 7 | 6 | 7.87 |
| 8 | 9 | 7.87 |
| 9 | 6 | 7.87 |
| 10 | 8 | 7.87 |
| 11 | 4 | 7.87 |
| 12 | 13 | 7.87 |
| 13 | 3 | 7.87 |
| 14 | 8 | 7.87 |
| 15 | 12 | 7.87 |
| 16 | 6 | 7.87 |
| 17 | 7 | 7.87 |
| 18 | 9 | 7.87 |
| 19 | 7 | 7.87 |
| Total | 299 | 299.00 |
A chi-squared goodness-of-fit test results in a chi-squared statistic of 45.29 with 37 degrees of freedom. The probability a random game would produce results more skewed than this is 16.5%.
Table 2 shows the results of a Gaussian test on various arc sizes centered around the center number bet in first experiment. For the five-number arc we covered, the expected number of wins on a fair wheel would be 39.3. We had only 29. Probability of results that bad, or worse, in a fair game is 3.84%.
Table 2
| Arc Size | Observations | Expectations | Size Std. Deviation |
Num Std. Deviation |
Probability |
|---|---|---|---|---|---|
| 1 | 8 | 7.87 | 2.77 | 0.05 | 0.518957 |
| 3 | 18 | 23.61 | 4.66 | -1.20 | 0.114658 |
| 5 | 29 | 39.34 | 5.85 | -1.77 | 0.038417 |
| 7 | 44 | 55.08 | 6.70 | -1.65 | 0.049187 |
| 17 | 124 | 133.76 | 8.60 | -1.14 | 0.128074 |
While our results were certainly south of expectations, it still could have easily been ordinary bad luck. However, I calculated if I kept losing at a similar rate, it would just take a larger sample size to make a case of unfair play. After many meetings and Emails it was decided to go further with a second experiment.
Second Experiment
To make a valid case of a casino game not playing fairly, an experiment to prove it should be reproducible. After a lot of discussion, it was decided to test for a shortage of wins betting $5 on every number in a five-number arc. It was decided to do this for 1,000 spins at three different wheels. Besides Mr. S playing, there was always at least one witness, either me or Mr. C. It was decided that after completing the play, we would examine the data and decide what to do next. If it looked like we were being given a non-random game, beyond a reasonable doubt, we planned to go public with our evidence.
At the point where this story ends we had 1,204 spins of data. We knew results were a bit south of expectations, but according to Mr. S, the games were performing randomly most of the time and in "threatened" mode only some of the time.
Based on this review of the data, we felt we had not been losing enough to warrant continued play.
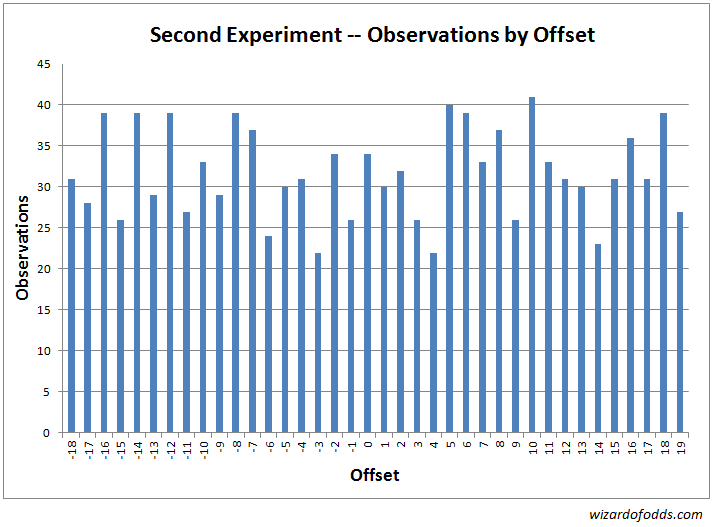
Following are the results and analysis of the second experiment. To start, the following graph and table 3 show the frequency of each offset between the center of the arc bet and where the ball landed.

Table 3
| Offset | Observations | Expectations |
|---|---|---|
| -18 | 31 | 31.68 |
| -17 | 28 | 31.68 |
| -16 | 39 | 31.68 |
| -15 | 26 | 31.68 |
| -14 | 39 | 31.68 |
| -13 | 29 | 31.68 |
| -12 | 39 | 31.68 |
| -11 | 27 | 31.68 |
| -10 | 33 | 31.68 |
| -9 | 29 | 31.68 |
| -8 | 39 | 31.68 |
| -7 | 37 | 31.68 |
| -6 | 24 | 31.68 |
| -5 | 30 | 31.68 |
| -4 | 31 | 31.68 |
| -3 | 22 | 31.68 |
| -2 | 34 | 31.68 |
| -1 | 26 | 31.68 |
| 0 | 34 | 31.68 |
| 1 | 30 | 31.68 |
| 2 | 32 | 31.68 |
| 3 | 26 | 31.68 |
| 4 | 22 | 31.68 |
| 5 | 40 | 31.68 |
| 6 | 39 | 31.68 |
| 7 | 33 | 31.68 |
| 8 | 37 | 31.68 |
| 9 | 26 | 31.68 |
| 10 | 41 | 31.68 |
| 11 | 33 | 31.68 |
| 12 | 31 | 31.68 |
| 13 | 30 | 31.68 |
| 14 | 23 | 31.68 |
| 15 | 31 | 31.68 |
| 16 | 36 | 31.68 |
| 17 | 31 | 31.68 |
| 18 | 39 | 31.68 |
| 19 | 27 | 31.68 |
| Total | 1204 | 1204.00 |
A chi-squared goodness-of-fit test results in a chi-squared statistic of 34.79 with 37 degrees of freedom. The probability a random game would produce results more skewed than this is 57.32%.
Table 4 shows the results of a Gaussian test on various arc sizes centered around the center number bet. All arc sizes test well within the normal range.
Table 4
| Arc Size | Observations | Expectations | Size Std. Deviation |
Num Std. Deviation |
Probability |
|---|---|---|---|---|---|
| 1 | 34 | 31.68421053 | 5.55 | 0.42 | 0.661637 |
| 3 | 90 | 95.05263158 | 9.36 | -0.54 | 0.294599 |
| 5 | 156 | 158.4210526 | 11.73 | -0.21 | 0.418235 |
| 7 | 204 | 221.7894737 | 13.45 | -1.32 | 0.092997 |
| 17 | 536 | 538.6315789 | 17.25 | -0.15 | 0.439385 |
Combined Results
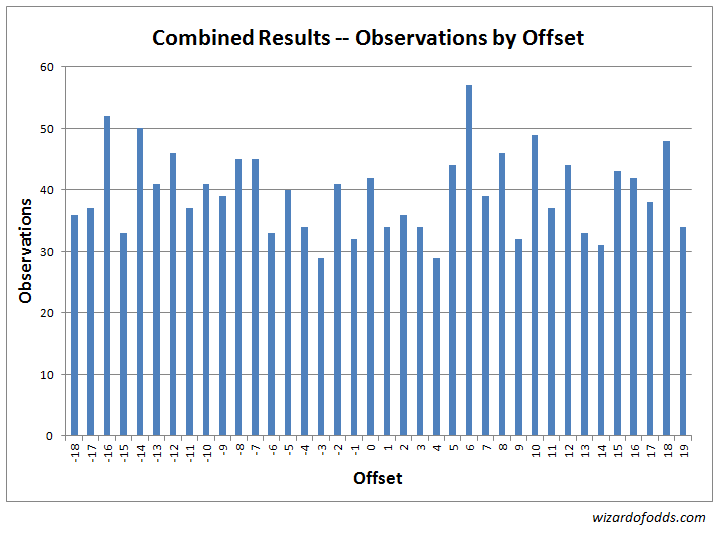
Following are the data from the first and second experiments combined. To start, the following graph and table 5 show the frequency of each offset between the center of the arc bet and where the ball landed.

Table 5
| Offset | Observations | Expectations |
|---|---|---|
| -18 | 36 | 39.55 |
| -17 | 37 | 39.55 |
| -16 | 52 | 39.55 |
| -15 | 33 | 39.55 |
| -14 | 50 | 39.55 |
| -13 | 41 | 39.55 |
| -12 | 46 | 39.55 |
| -11 | 37 | 39.55 |
| -10 | 41 | 39.55 |
| -9 | 39 | 39.55 |
| -8 | 45 | 39.55 |
| -7 | 45 | 39.55 |
| -6 | 33 | 39.55 |
| -5 | 40 | 39.55 |
| -4 | 34 | 39.55 |
| -3 | 29 | 39.55 |
| -2 | 41 | 39.55 |
| -1 | 32 | 39.55 |
| 0 | 42 | 39.55 |
| 1 | 34 | 39.55 |
| 2 | 36 | 39.55 |
| 3 | 34 | 39.55 |
| 4 | 29 | 39.55 |
| 5 | 44 | 39.55 |
| 6 | 57 | 39.55 |
| 7 | 39 | 39.55 |
| 8 | 46 | 39.55 |
| 9 | 32 | 39.55 |
| 10 | 49 | 39.55 |
| 11 | 37 | 39.55 |
| 12 | 44 | 39.55 |
| 13 | 33 | 39.55 |
| 14 | 31 | 39.55 |
| 15 | 43 | 39.55 |
| 16 | 42 | 39.55 |
| 17 | 38 | 39.55 |
| 18 | 48 | 39.55 |
| 19 | 34 | 39.55 |
| Total | 1503 | 1503.00 |
A chi-squared goodness-of-fit test results in a chi-squared statistic of 41.75 with 37 degrees of freedom. The probability a random game would produce results more skewed than this is 27.19%.
Table 6 shows the results of a Gaussian test on various arc sizes centered around the center number bet. All of the tests fall within a reasonable range for a fair game.
Table 6
| Arc Size | Observations | Expectations | Size Std. Deviation |
Num Std. Deviation |
Probability |
|---|---|---|---|---|---|
| 1 | 42 | 39.55263158 | 6.21 | 0.39 | 0.653346 |
| 3 | 108 | 118.6578947 | 10.45 | -1.02 | 0.153986 |
| 5 | 185 | 197.7631579 | 13.11 | -0.97 | 0.165050 |
| 7 | 248 | 276.8684211 | 15.03 | -1.92 | 0.027374 |
| 17 | 660 | 672.3947368 | 19.28 | -0.64 | 0.260114 |
The correlation coefficient between the results of the first and second experiments is 0.153853. In plain English, that means there was a slight correlation but well within what could be expected from two random sets of data.
Conclusion
I require a very high standard of evidence before I will say that any game is not playing according to the natural probabilities of a fair game. In this case, that standard was not met. In other words, I have no justification to make any accusations that the Organic Roulette machines are playing unfairly.
Responses
I offered Mr. S the chance to preview this page before announcing it to the general public. He made many good suggestions and corrections. In the end, he still had some issues with the way I worded things. So, I gave him the opportunity to publish a response, which he did. It is titled Another perspective on the Interblock experiment results by Mr. S.
I always like to get the last word, so I published a counter-response titled, Response to Response by Mr. S. on the Organic Roulette Experiment by Michael Shackleford.


