Wizard Recommends
-
 $11000 Welcome Bonus
 -
 $3000 Welcome Bonus
 -
 UP TO $777 BONUS
Sports - FAQ
Current odds for a boxing match between Vargas and Quartey are -240 Vargas and +190 for Quartey. How does this work if I put $100 for Vargas or $100 for Quartey?
A $240 bet on Vargas will win $100. A $100 bet on Quartey will win $190. Of course, you can bet any amount, but the winnings will still be in the same proportion. If you bet $100 on Vargas, then you will win $100 × (100/240)=$41.67.
In sports betting against the spread, it seems to me that the winner pays the 10% commission, not the loser. What am I missing?
You can look at it both ways. For example, suppose you bet $11 to win $10 on a game.
Loser pays: One could say it is an even-money bet, with a $1 refundable fee if you win. So, only the losers end up paying the fee.
Winner pays: A fair even-money bet would win $11 for an $11 bet. However, if the bet wins, the winner gets only $10. The missing dollar could be viewed as a commission or fee.
Personally, I view it as both pay in the form of a 4.54% house edge, assuming a 50% probability of winning.
Are there any states, other than Nevada, where it is legal to bet on professional sports such as baseball and football?
The only state besides Nevada with legal sports betting is in Delaware. In that state it is run through the lottery, so the odds are pretty bad.
I was recently looking at a football pool that was taking place. This was one of those where there is a grid of 100 boxes and the numbers 0-9 run along the X and Y axises and correspond to the last number of the score. I am not a football fan and did not bet on this pool but I am a gambler and don't think it is such a great bet.
I am taking for granted that you know the type of pool that I am referring to. Each box costs $5 and pay outs are each quarter. If your box wins you win $125 and it is possible to win all 4 quarters if the last numbers remain the same winning $500 for a payout of 100 to 1.
The person soliciting the bet was trying to tell me that the odds of winning the $500 are 100 to 1. I disagree. First the box that has 0 + 7 stands a much better chance of winning than the 2 + 9 box. However, the odds of 0 + 7 remaining the last 2 numbers throughout the game must be high. If the boxes are chosen for you through a random process, can you tell me the approximate odds of winning the $500 prize?
Assuming the cells in the grid are chosen at random, then the odds of winning any one quarter would be 1/100. Assuming each quarter was an independent event, which they aren't, the odds of winning all four quarters would be (1/100)4 = 1 in 100 million.
Just read your latest ’Ask the Wizard’ section. You said that sport betting would be one of the ways to earn a living. Could you elaborate a little bit? Does it have similar edge over the bookmaker as blackjack with card counting does over the casino? Thanks.
Unfortunately I can’t elaborate much. Sports betting is not my strong point, although I plan to learn more about it when I have the time. I will say it is hard to compare the profitability of sports betting to card counting. Card counting is very technical and by the book. Making money sports betting requires more judgement and is more subject to opinion. There are various strategies one can employ to make money sports betting, for example looking to arbitrage games by taking both sides at different casinos under different point spreads, looking to exploit unusual proposition bets, or going after correlated parlays. I would recommend ’Sharp Sports Betting’ by Stanford Wong for more information on winning at sports betting.
I have seen various NFL handicappers boast about their percentages of winning picks. What is the probability a random picker would get 50%, 55%, and 60% over 1, 3, and 5 seasons?
The following table shows the probability of attaining every percentage from 50% to 60%, in increments of 1%, by each number of seasons from 1 to 5. This is based on a 259 game season. I also assume that the overall percentage is rounded down. For example if a handicapper picked 132 out of 259 games, for a percentage of 50.97%, he would only get credit for picking 50%, since he didn’t quite attain 51%. It would not surprise me if these boasting handicappers are rounding in their own favor.
Probability of Handicapping Percentages in the NFL
| Ratio | 1 Seasons | 2 Seasons | 3 Seasons | 4 Seasons | 5 Seasons |
| 0.5 | 0.5 | 0.517523 | 0.5 | 0.512393 | 0.5 |
| 0.51 | 0.354641 | 0.314437 | 0.282985 | 0.257059 | 0.234993 |
| 0.52 | 0.267178 | 0.178085 | 0.125486 | 0.101366 | 0.074229 |
| 0.53 | 0.160065 | 0.086589 | 0.049447 | 0.025155 | 0.015098 |
| 0.54 | 0.106982 | 0.035817 | 0.013066 | 0.004959 | 0.001926 |
| 0.55 | 0.053095 | 0.012519 | 0.002569 | 0.000687 | 0.000152 |
| 0.56 | 0.023385 | 0.00282 | 0.000373 | 0.000051 | 0.000007 |
| 0.57 | 0.012645 | 0.00067 | 0.000053 | 0.000003 | 0 |
| 0.58 | 0.00453 | 0.000133 | 0.000004 | 0 | 0 |
| 0.59 | 0.00213 | 0.000022 | 0 | 0 | 0 |
| 0.6 | 0.000617 | 0.000003 | 0 | 0 | 0 |
I’d like your opinion on an NFL pool. Tickets cost $25 each and consist of three random teams, in a given order. Each week the ticket holder with the highest three scoring teams, in the correct order, wins $1000. What is the actual value of each ticket?
There are 17 regular weeks in the NFL season and 32 teams. The probability of winning any given week is 1 in 32*31*30 = 29760. The expected value of each ticket is $1000*17/29760 = 57.12 cents. So the expected return is 2.28%, or a house edge of 97.72%!
Sorry to bother you as your web page states, but have you used your mathematical prowess to find anomalies in the odds on sports bets, or calculated a way to have a guaranteed return based on that info?
The last couple years I have been devoting a lot of time to sports betting, much more than any other form of gambling. Unless you can play two sport books against each other via different lines, an opportunity which is very rare, there are no guaranteed winning ways to make money sports betting. It is too early to reveal any secrets but I look for any perceived bet with a player advantage and then make my bet. You might like to see some information I did to recently in my sports betting appendix 2.
If a university’s football team has a 10% chance of winning game 1 and a 30% chance of winning game 2, and a 65% chance of losing both games, what are their chances of winning exactly once?
If we assumed the games were independent then the probability of losing both would be 90%*70%=63%. But since you say the probability of losing both is actually 65% (which is more than the 63%), that means the two events are correlated. If the probability of losing both is 65% and just losing game 2 is 70%, then the probability of winning game 1 and losing game 2 must be 5%. Using the same logic the probability of losing game 1 and winning game 2 must be 25%. That only leaves 5% for winning both games. So the probability of winning exactly once is 25%+5% = 30%.
My question was specific to the Monday night football game tonight (Dallas @ Washington). There is rain in Washington and has been for a few hours now. This rain will continue through the game and into the next day. I was wondering what effect rain had on an over/under NFL bet? Is there some trend or other advice you can give me?
I do not know the effect of rain on the total. However I do know that sharp handicappers consider the weather very seriously and move the line to reflect the temperature, precipitation, wind speed, and things like that.
Hi wiz, Let’s suppose I conjure up a sports betting system which requires $1K bets to return $80K per year. In order to produce this return approximately 250-300 bets per year are needed. Would the sports books eventually bar me in a similar fashion to the way the casinos bar card counters? Can you become a successful sports bettor openly, or do you have to sneak around like a card counter?
First, I’m skeptical that anyone could make 80K with 1K bets and a bankroll of only 250-300. And don’t even get me started about the word "system." To answer your question, for the most part the best sports bettors may practice openly. Even if a sports book did forbid a professional’s action or 86 them from the property it would be easy to get someone else to do the betting. Then again I once went to a Super Bowl proposition bet seminar by Fezzik, a professional gambler, and he gave his presentation in a Halloween mask.
Do you have any advice for picking the terminal digit in Super Bowl pools?
The office pools I have seen randomized the tables by assigning a random digit to each row and column. However if you can choose the actual terminal digits the following table shows the frequency of each terminal digit for the final score of either team, based on every NFL game from 1983 to 2003.
NFL Terminal Digits per Side
|
Digit |
Frequency |
Probability |
|
0 |
1887 |
17.75% |
|
1 |
1097 |
10.32% |
|
2 |
348 |
3.27% |
|
3 |
1382 |
13.00% |
|
4 |
1608 |
15.13% |
|
5 |
396 |
3.73% |
|
6 |
848 |
7.98% |
|
7 |
1945 |
18.30% |
|
8 |
631 |
5.94% |
|
9 |
488 |
4.59% |
|
Total |
10630 |
100% |
So this table shows 7 is the best choice, followed by 0, 4, and 3.
I would love to see more detail on your "NFL picks" numerical model. Hey, if you start utilizing this to actually make bets, wouldn’t this be defined as a "betting system"?
Some of them I like more than others. My model creates what it estimates to be a fair spread in every game and I list the ones that have a disparity of more than a chosen number of points. Personally I bet more on the ones with the larger disparities. However until I have proven my picks are any good I think it would be pretentious to post degrees of confidence.
With regards to your NFL picks, are they all weighted the same, that is to say, are any of the picks stronger than others according to your model?
Some of them I like more than others. My model creates what it estimates to be a fair spread in every game and I list the ones that have a disparity of more than a chosen number of points. Personally I bet more on the ones with the larger disparities. However until I have proven my picks are any good I think it would be pretentious to post degrees of confidence.
Are you a Packers fan at heart? I am. It looks like you are betting with your heart and the packers are killing your great NFL picks. Great percentage even with the packers not coming through for you. Just thought you might like the observation.
The reason has nothing to do with team loyalty. My program rated them the fifth best team at the close of the 2004 season, and that I carry that power rating over into the 2005 season. However maybe it is too slow too react to recent history. Something for me to think about.
I saw someone offer 2-1 against a player picking 57% over 100 games against the spread. While I think 57% is a tough number, given the small sample size I think this might be a good bet. My question is this - if a better was a 50% lifetime picker, ignoring vig and ties, (i.e. coin toss situation) would this be a good bet? If not what overall percentage would one have to make this a good deal for the picker?
For the 2 to 1 bets, the largest sample size in which this is a good bet is 14 games. Picking randomly you would have a 39.5264% chance of picking 57% or better, or 8 or more right. You need to have better than a 33.3333% probability for it to be a good bet. 21 is close to fair, but the probability is slightly too small at 33.1812%. The larger the number of picks required the lower the required percentage should be. For example, if 1000 picks were required the greatest number required to have more than a 1/3 chance of winning would be 507. The probability of getting 507 or more right in 1000 picks is 34.05%.
I am a long time football fan and gambler. I am very interested in your numerical model for football and am trying to make my own model since I already know I can't win betting football on my knowledge alone (I have tried). So I figured to give a statistical approach a try. I am using the statistical program SPSS. My question to you is what variables are you using in your model?
The only things that go into the model are scores and home field advantage. Sometimes I seek outside opinions on major injuries, such as Ben Roethlisberger in week 6, or New Orleans playing home games in San Antonio.
Welcome back Wizard. You are no longer just the Wizard of Odds but from your performance, you are also the Wizard of NFL Picks. I’m only at 51.7% at the casino pool. I have a simple request. Is it possible to list your picks for ALL GAMES each week if it doesn’t take too much of your time?
Thanks. You probably sent this before week four, which was a bad week for me. Now, after five weeks my record is 17 and 13, for a 56.7% average, which is good but not great. I think that as a bonus to my newsletter readers I’ll give my thoughts on all the games.
Since you're doing football now I have a question about parlays. I recently placed a bet where I picked the over/under in each of the 4 quarters of the Steelers/Chargers MNF game and won. (Only quarters, no half or total.) Now the sports book won't pay because they say there's correlation -- that winning one quarter makes it more likely that I'll win another quarter. I believe each quarter of a game is mutually exclusive but they disagree. What does the Wizard think?
First, whoever accepted this bet should honor it, on principle alone. A gentleman honors his debts, especially gambling debts. Second, although I haven't studied it I think the quarters may actually be negatively correlated. For example if the first quarter has a low total it may be more likely that either team will have good field position at the beginning of the second quarter, and thus likely to make the second quarter high scoring, and vise versa.
Wizard, I’ve got a question regarding my "true" winning percentage for NFL picks. I tell my friends that I have not had a losing season for the past 5 years (which is true), betting from Weeks 3-16 with an average of 2-3 picks per week. My thing is that I have a great feel for games and I bet substantially more in games where I believe the odds are in my favor. As an example, I have made 9 bets this year, 4 of which were $55, hitting 3 of those picks. I have made 3 $110 bets, winning 1 of those. But I loved two games in which I bet $330 on one, and $600 (even line), and won both. Absolutely, I’m 6 of 9 for 66% clip, but being that I hit on the games I was more sure about, it really signifies around an 80% clip (money wise). Does this make sense to you? I’ve roughly done this, it turned out, when I calculated it for the last 5 years (60-70% in picks, but ~80% when factoring how much money I wagered). Can you tell me an easy way to factor in the amount bet, and If i’m correct in my assumptions? Thank you very much.
I have been thinking a lot about this lately. In my opinion a winning percentage should have an equal weighting per game. You should also have a separate statistic on your overall return of investment, however any statistic should be backed up with a list of the side, date, line source, point spread, and the odds (usually -110). Another issue you don’t bring up is what to do if you have to lay -120 off of a 3 or 7 point spread. It would be easier to attain a good win percentage if you loaded your picks with such bets. So I believe a return on investment figure should be kept even if flat betting. Another thing that bothers me about some other handicappers is they quote lines that are nowhere to be seen. I think it is okay to shop around a bit but quoted lines should be not difficult to find. I admit I don’t do some of these things myself this season, because I didn’t think of these things when I started. Next year, if I do this again, I will document my results as an investment as well.
Do you advise playing the money line or the spread on your NFL picks or does it not matter one way or another?
Regardless of the reason for making the bet, in general it is better to bet underdogs on the money line and favorites against the spread.
I have always wanted to do some of my own NFL handicapping but I am having a hard time finding a site, hopefully free, to download historical data by team. Any suggestions? Downloadable files would be my preference since cutting and pasting off of a web page isn’t real practical but I would be willing to do so if needed. Also, information such as weather and turf conditions would be a great help.
Personally, I use the NFL Access database from Mr. NFL, which costs $99. If there is anything as good for less I'm not aware of it.
Your system for your NFL picks seems to be weighted too heavily towards the underdog. Only 8 out of 49 games have you picking the favorite. In one you pick a team on an even line. Is this a flaw in your system or are people more apt to pick favorites and your system is trying to take advantage of their tendency? I didn’t do an analysis but it tends to be from my observation that few bets are won in the spread range without the team actually winning the game.
Historically speaking underdogs are a better bet. Here are the results every game played from the start of the 1983 season through week 10 of the 2005 season.
Favorite wins against spread: 2554 games
Underdog wins against spread: 2724 games
Game ends exactly on spread: 150 games
So on resolved bets the underdog have won 51.61% of the time. It is also well known that square bettors prefer to bet favorites, creating value on the underdogs.
This year our "Football Bet Taker" upped the juice on over/under bets from 10% to 20%, and eliminated the 10% juice on parlays. So this year instead of making 2 separate o/u bets, I have been parlaying the 2 bets at a payoff of 2.5 to 1. Is this a good strategy to use?
The expected return on the straight bets would be (0.5*1 + 0.5*(-1.2))/1.2 = -8.33%. The expected return on the parlay would be 0.25*2.5 + 0.75*-1 = -12.5%. However if I were to only bet two games and want to win or go bust trying then I would go with the parlay. More importantly I would boycott this bookie out of principle, because I’ve never heard of having to lay -120 on straight bets before.
In two different sections on your site, you mention that in general it is better to bet on underdogs rather than favorites against the money line. However, as you point out in your Sports Betting Appendix 3, the money line house edge is LOWER when betting on the favorite. Isn’t that a contradiction? Isn’t it true for a bet of any type to seek out the lowest house edge?
Good point. After giving it some thought I have decided to remove my sports betting appendix 3. It was based on the assumption that the fair line is exactly between the two money lines. For example in the last Super Bowl the money lines were generally Seattle +160 and Pittsburgh -180. My appendix was based on the unrealistic assumption that the fair money lines would be +/- 170. In reality money lines are market driven. Square action on the money line tends to favor the favorite, creating value on the underdog. Assuming Pittsburgh as a 4-point favorite was fair historical data suggests a 4-point favorite has about a 61% chance of winning. That would make the fair money lines +156 on Seattle, and -156 on Pittsburgh. To remind you most casinos had the money lines at +160/-180. Of course Pittsburgh won the game this time, but historically speaking I’m sure you would make out better betting underdogs on the money line over favorites.
I am in an NFL squares pool and I have drawn very good numbers. 7 and 4 for pittsburgh and 4 and 0 for seattle. I was wondering what the probability is on me winning this year?
For my readers who may not understand the question, a Super Bowl pool has a 10 by 10 grid. Players will buy squares for a set amount each, writing the name of the buyer in each square. After all 100 squares have been purchased the rows and columns should be given headings randomly from 0 to 9. Kind of like a 10 by 10 multiplication table, only with the row and column headings randomly shuffled. Then the terminal digit of each team’s score will used to determine the winner. The reason for the shuffling is that some terminal digits are much more likely than others, as you will see below. For example, whoever ended up with the Seattle 0, Pittsburgh 1 square would have won the pool, because the final score was Seattle 10, Pittsburgh 21.
The following table shows the frequency of each combination in every NFL game from the 1983 to 2005 seasons. It should be noted that the 2-point conversion rule came along about 1998, which would have the effect of smoothing out the distribution a bit.
Terminal Digit in the NFL - Away by Home Total
| Away Team | Home Team | Total | |||||||||
|---|---|---|---|---|---|---|---|---|---|---|---|
| 0 | 1 | 2 | 3 | 4 | 5 | 6 | 7 | 8 | 9 | ||
| 0 | 126 | 104 | 34 | 160 | 138 | 37 | 99 | 237 | 64 | 32 | 1031 |
| 1 | 73 | 40 | 17 | 41 | 103 | 21 | 36 | 117 | 67 | 31 | 546 |
| 2 | 25 | 15 | 1 | 20 | 30 | 9 | 13 | 33 | 9 | 12 | 167 |
| 3 | 194 | 69 | 33 | 66 | 102 | 40 | 102 | 132 | 43 | 40 | 821 |
| 4 | 122 | 133 | 27 | 78 | 108 | 27 | 48 | 215 | 59 | 35 | 852 |
| 5 | 32 | 12 | 12 | 21 | 21 | 9 | 13 | 36 | 22 | 5 | 183 |
| 6 | 91 | 47 | 17 | 75 | 57 | 7 | 28 | 57 | 25 | 39 | 443 |
| 7 | 217 | 115 | 35 | 135 | 195 | 47 | 65 | 125 | 69 | 47 | 1050 |
| 8 | 43 | 59 | 12 | 24 | 41 | 23 | 20 | 38 | 15 | 7 | 282 |
| 9 | 48 | 28 | 17 | 33 | 40 | 14 | 29 | 33 | 14 | 7 | 263 |
| Total | 971 | 622 | 205 | 653 | 835 | 234 | 453 | 1023 | 387 | 255 | 5638 |
The next table shows the probability of each combination based on the totals in the table above.
Terminal Digit in the NFL — Away by Home Probability
| Away Team | Home Team | Total | |||||||||
|---|---|---|---|---|---|---|---|---|---|---|---|
| 0 | 1 | 2 | 3 | 4 | 5 | 6 | 7 | 8 | 9 | ||
| 0 | 0.0223 | 0.0184 | 0.006 | 0.0284 | 0.0245 | 0.0066 | 0.0176 | 0.042 | 0.0114 | 0.0057 | 0.1829 |
| 1 | 0.0129 | 0.0071 | 0.003 | 0.0073 | 0.0183 | 0.0037 | 0.0064 | 0.0208 | 0.0119 | 0.0055 | 0.0968 |
| 2 | 0.0044 | 0.0027 | 0.0002 | 0.0035 | 0.0053 | 0.0016 | 0.0023 | 0.0059 | 0.0016 | 0.0021 | 0.0296 |
| 3 | 0.0344 | 0.0122 | 0.0059 | 0.0117 | 0.0181 | 0.0071 | 0.0181 | 0.0234 | 0.0076 | 0.0071 | 0.1456 |
| 4 | 0.0216 | 0.0236 | 0.0048 | 0.0138 | 0.0192 | 0.0048 | 0.0085 | 0.0381 | 0.0105 | 0.0062 | 0.1511 |
| 5 | 0.0057 | 0.0021 | 0.0021 | 0.0037 | 0.0037 | 0.0016 | 0.0023 | 0.0064 | 0.0039 | 0.0009 | 0.0325 |
| 6 | 0.0161 | 0.0083 | 0.003 | 0.0133 | 0.0101 | 0.0012 | 0.005 | 0.0101 | 0.0044 | 0.0069 | 0.0786 |
| 7 | 0.0385 | 0.0204 | 0.0062 | 0.0239 | 0.0346 | 0.0083 | 0.0115 | 0.0222 | 0.0122 | 0.0083 | 0.1862 |
| 8 | 0.0076 | 0.0105 | 0.0021 | 0.0043 | 0.0073 | 0.0041 | 0.0035 | 0.0067 | 0.0027 | 0.0012 | 0.05 |
| 9 | 0.0085 | 0.005 | 0.003 | 0.0059 | 0.0071 | 0.0025 | 0.0051 | 0.0059 | 0.0025 | 0.0012 | 0.0466 |
| Total | 0.1722 | 0.1103 | 0.0364 | 0.1158 | 0.1481 | 0.0415 | 0.0803 | 0.1814 | 0.0686 | 0.0452 | 1 |
Although there is a ceremonial home team in the Super Bowl, I think we can ignore that. Let's also ignore everything about both teams and go strictly off of the historical averages above. Finally, let’s ignore the fact that the Super Bowl can not end in a tie, which would make a match like 4/4 a little less likely to win. So let's take an average when the terminal digits are different. For example the probability of your Pittsburgh 7, Seattle 4 square would be the average of Away 7, Home 4; and Away 4, Home 7. Doing so results in the following probability for each of your squares.
Pitts 7, Sea 4: (0.0346+0.0381)/2 = 0.0364
Pitts 7, Sea 0: (0.0385+0.0420)/2 = 0.0403
Pitts 4, Sea 4: 0.0192
Pitts 4, Sea 0: (0.0216+0.0245)/2 = 0.0231
So your total probability of winning one of these is 11.90%. Considering you only covered 4% of the squares you made out well.
Although you didn't specifically ask, here is how often each terminal digit occurred. It shows that overall from most the frequent the order is 7043168952.
Terminal Digit in the NFL — Away and Home Totals
| Terminal Digit |
Away Team | Home Team | Total |
|---|---|---|---|
| 0 | 1031 | 971 | 2002 |
| 1 | 546 | 622 | 1168 |
| 2 | 167 | 205 | 372 |
| 3 | 821 | 653 | 1474 |
| 4 | 852 | 835 | 1687 |
| 5 | 183 | 234 | 417 |
| 6 | 443 | 453 | 896 |
| 7 | 1050 | 1023 | 2073 |
| 8 | 282 | 387 | 669 |
| 9 | 263 | 255 | 518 |
Finally, here is the probability of each terminal digit.
Terminal Digit in the NFL — Away and Home Probabilities
| Terminal Digit |
Away Team | Home Team | Total |
|---|---|---|---|
| 0 | 0.1829 | 0.1722 | 0.1775 |
| 1 | 0.0968 | 0.1103 | 0.1036 |
| 2 | 0.0296 | 0.0364 | 0.033 |
| 3 | 0.1456 | 0.1158 | 0.1307 |
| 4 | 0.1511 | 0.1481 | 0.1496 |
| 5 | 0.0325 | 0.0415 | 0.037 |
| 6 | 0.0786 | 0.0803 | 0.0795 |
| 7 | 0.1862 | 0.1814 | 0.1838 |
| 8 | 0.05 | 0.0686 | 0.0593 |
| 9 | 0.0466 | 0.0452 | 0.0459 |
For more on this topic, visit Football Squares Mathematical and Statistical Strategy.
People have a misconception that sports betting limits in Vegas are really high, which in my experience only applies to football and not always in that case. Could you tell me the approximate limits in Vegas sports books on the 4 major sports? Thank you for your time.
I don’t count hockey as a major sport because it gets very little action. I’m told that the Coast casinos have the highest limits. There is no maximum set in stone that I know of but they take large bets on a case by case basis. Here is what I think they would probably take on the average game.
NFL side: $50,000
NFL total: $5000
MLB money line: $10,000
MLB total: $2000
NBA side: $10,000
NBA total: $2,000
With many online books offering halftime wagering, I’d love to know your opinion on "dutching". Sometimes it’s obvious, but at what point would you consider betting the opposite of your game bet at halftime? Also, what amount would you consider if you found a favorable situation?
I assume by "dutching" you mean hedging. The sixth of my ten commandments of gambling is "Thou shalt not hedge thy bets." The only time I would make an exception is when the hedge bet itself has a positive expected value, or life changing amounts of money are at stake.
What is the maximum amount of money you can win on a college football wager in a Vegas casino without having to provide your personal information to the casino when you cash out your ticket? I’d like to know the amount I can win (per wager) and still have them pay me cash with no questions asked.
$10,000. A cash transaction of more than $10,000, whether in sports or not, will necessitate a CTR (cash transaction report). You may also ask to be paid in chips, although the same CTR would be generated if and when you cashed them in.
Other than the free sites, can you recommend a site where I can get professional sports handicapping for a monthly fee, or percent of win.
No. I do not endorse any touts.
You have talked about your betting of the underdogs in the NFL. Did you simply bet the home underdog each time or was it more complicated than that? And most importantly, what line determined if it was a home dog...The early line or the line just before the game. Thanks.
I don’t just blindly bet underdogs, even if I have to lay -105 only, which is the case this season at the Plaza in downtown Las Vegas. If I detect only a small advantage on a sports bet, I won’t bet it. In sports I always assume a certain margin of error, because ultimately people play the game, not statistics. However, if I can find a better than the market line, or the side comes with the recommendation of a trusted handicapper, then I would be happy to make the bet.
Thanks for the great website! My father and I are having an argument about hedging bets and could really use your help! The particular situation involves a bet on the Super Bowl. Prior to the start of the season (my father can’t remember the year) my uncle placed a bet that New England would win the Super Bowl. The bet paid 60 to 1. Just before the Super Bowl (in which New England was playing) my uncle hedged his bet (father can’t remember the details) giving up the potential $6,000 pay day but guaranteeing a $3,000 one instead. I’m convinced that this was a sucker bet but my father won’t listen to me. I’m arguing that by hedging in this spot he was giving up expected value and the smart bettor never does this. My father is arguing that it’s fine to give up the expected value because of the money involved and the fact that this bet doesn’t come up often, exactly the same as insuring your house. Of course, I argue that home ownership is inherently different than sports betting in that one can be avoided while the other really can’t. What are your thoughts? Please help us settle this!
The Seventh of my Ten Commandments of Gambling is, "Thou shalt not hedge thy bets." However, in my remarks I add, "Exceptions can be made for insuring life-changing amounts of money." So if the surrender value of $3,000 is a life-changing amount of money to him, and if the probability of winning were not much more than 50%, then I wouldn’t begrudge his decision. However, unless this was in 2002, the probability of New England winning was much higher than 50%. The other two years they played in the Super Bowl, 2004 and 2005, they were 7-point favorites. I would estimate the probability of winning either year was about 71%. A fair surrender value would have been 0.71 × $6100 (including his original bet back) = $4,331. The house edge on the offer, which was equivalent to an even money bet on the other team, was 29%-71% = 42%. So, if I’m right about the year, he made a very bad decision. He could have gotten much better odds on the open market by betting the other team on the money line. Whoever offered only $3,000 was either very ignorant of the game or took unfair advantage. Interestingly, New England won all three of their recent Super Bowls by three points.
What is the probability of an NFL game ending in a tie?
From the 1983 to 2007 seasons, there were 10 ties over 5,901 regular season games played. Rules dictate that a game can not end in a tie in the post-season. So that would make the probability, based on historical games, 0.17%, or about 1 in 590.
What is the standard deviation of the difference between the final point differential between the two teams in an NFL game and the pointspread of that game?
For the benefit of other readers, let’s look at an example from the last Super Bowl, to illustrate what you are asking. The Patriots were a 12-point favorite, but lost by 3. So the game finished 15 points away from the point spread. If I understand the question correctly, you are asking about the standard deviation of this difference. The mean difference was close to zero for each league studied. Here is what I get for the standard deviation:
NFL 13.31 (based on 2000 to 2007 seasons)
College Football 15.72 (based on 1993 to 2007 seasons)
NBA 11.39 (based on 1987 to 2003 seasons)
So, the 2008 Super Bowl finished 15/13.31 = 1.13 standard deviations away from expectations. I’m ignoring the adjustment factor for a discrete distribution, to keep things as simple as possible. The probability of being 1.13 standard deviations or more from expectations, in either direction is 25.85%. This can be found in Excel, using the formula 2 × normsdist(-1.13).
As a sports bettor, who likes to play underdogs, and who likes to shop around for lines, I know the value of finding each and every extra half point you can. In your typical NFL or NBA game, what is each half point worth to you? I know that a gambler at -110 on a fair line needs to hit 52.4% to break even. I know lines are dictated by the marketplace, but what would you say each half point is truly worth? If you could get a half point extra on the fair line of each game you bet would that make your break even point truly be 50%. Is there any way to calculate it? Thanks.
As I show in my page in the NBA, when buying a half point the probability of a win is 51.01%, a loss is 47.01%, and a push is 1.98%, assuming the bettor never buys the half point off of a spread of 0 or -1, which he shouldn’t do. If you only had to lay 110 for the extra half point, the expected return would be (0.5101 - 1.1×.4701)/1.1 = -0.64%. So, a free half point would not be enough to overcome the house edge.
Not that you asked, but if you lay 120, you can buy a half point at most sports books. If you were prepared to bet a game against the spread anyway, is the extra half point a good value? Laying 110, the house edge for a random picker is 4.45%, including ties. Laying 120, the house edge with the half point is 4.50%. So, buying a half point is marginally not worth the price.
The value of buying a half point in football depends a great deal on the point spread, because some margins of victory are much more likely than others. The only time it is worth buying the half point in the NFL is off of a point spread of 3. Unfortunately, the sports books know this too, and won’t let you do it off of 3, most of the time.
Knowing that team A scores 1.5 goals per game on average, and team B scores 1.2 goals per game on average, what are the chances that in a game between A and B:
1) A will score more than B
2) B will score more than A
3) Game finishes as a tie.
Is the information provided enough to calculate the probabilities for each outcome?
That does not take into account that the individual scores should be somewhat negatively correlated, and that the average points each team gives up is just as important as the average points scored. If we can assume that 1.5 and 1.2 are the expected number of points scored in the game, considering both offense and defense, and we ignore the correlation factor, then we can get a decent estimate on your three probabilities. There are lots of Super Bowl props like this, but based on who will score more touchdowns, field goals, interceptions, etc..
The first step is to use the Poisson distribution to estimate the probability of each number of goals for each team. The general formula is the probability that a team has g goals, with a mean of m, is e-m × mg/g!. In Excel, you can use the formula poisson(g,m,0). The following table shows the probability for 0 to 10 goals of both teams, using this formula.
Probabilities for 0 to 8 Goals for each Team
| Goals | Team A | Team B |
| 0 | 0.223130 | 0.301194 |
| 1 | 0.334695 | 0.361433 |
| 2 | 0.251021 | 0.216860 |
| 3 | 0.125511 | 0.086744 |
| 4 | 0.047067 | 0.026023 |
| 5 | 0.014120 | 0.006246 |
| 6 | 0.003530 | 0.001249 |
| 7 | 0.000756 | 0.000214 |
| 8 | 0.000142 | 0.000032 |
The next step is rather mundane, but you have to make a matrix of all the 81 possible combinations of 0 to 8 scores for each team. This is done by multiplying the probability of x scores for team A and y scores for team B, from the table above. The following table shows the probability of every score combination from 0-0 to 8-8.
The next table shows the winner according to each combination of goals, where T represents a tie.
Winner Combinations for Both Teams
| Goals Team A | Goals Team B | ||||||||
| 0 | 1 | 2 | 3 | 4 | 5 | 6 | 7 | 8 | |
| 0 | T | B | B | B | B | B | B | B | B |
| 1 | A | T | B | B | B | B | B | B | B |
| 2 | A | A | T | B | B | B | B | B | B |
| 3 | A | A | A | T | B | B | B | B | B |
| 4 | A | A | A | A | T | B | B | B | B |
| 5 | A | A | A | A | A | T | B | B | B |
| 6 | A | A | A | A | A | A | T | B | B |
| 7 | A | A | A | A | A | A | A | T | B |
| 8 | A | A | A | A | A | A | A | A | T |
Finally, you can use the sumif function in Excel to add the corresponding cells for all three possible outcomes of the bet. In this case the probabilities are:
A wins = 44.14%
B wins = 30.37%
Tie = 25.48%
Appendix C in Sharp Sports Betting by Stanford Wong gives the win/lose/tie probabilities for bets like this. For this case he lists 44%, 30%, and 25%. If anyone knows a simple formula for this kind of problem, I’m all ears.
Follow Up: I received an e-mail from Bob P., who always keeps me on my toes when it comes to math. Here is what he wrote.
Looked up the distrib of the difference between 2 uncorrelated Poissons. It’s a Skellam (new to me).Anyway, the question can then be posed as P(Z=0), P(Z>0), and P(Z<0) where Z is a Skellam with parameters 1.5 and 1.2.
If you haven’t already done it, you’ll be pleased to know
P(Tie) = P(Z=0) = .254817
P(A beats B) = P(Z>0) = .441465
P(B beats A) = P(Z<0) = 1 - .254817 - .441465 = .303718
almost exactly your answers.
The Wikipedia entry for a Skellam mentioned Bessel functions, which is about the point in calculus where I get scared to go further. So, I’m going to take Bob’s word on this one.
I’ve had good luck betting with teams that have had a streak of 5 losses and against teams that have won 5 in a row. I argue that unlike dice and roulette, where you say that the dice or ball has no memory, a professional sports team cannot win or lose endlessly. I chose 5 in a row after analyzing when the switch would happen more often. It doesn’t matter to me where they are playing or who is the starting pitcher, injuries, etc. Do you think I am correct in my thoughts?
I think these are good bets, but not for the reason you state. A sports team can, in theory, lose endlessly. One reason these are good bets anyway is they are going to be on big underdogs the vast majority of the time, and underdogs are generally stronger bets than favorites. For another reason, the square bettors are generally betting the other way in these situations, creating value your way.
I’m one of six people in an NFL handicapping contest. Each of us has to pick 70 games over the season against the line at a major Internet sports book, which has a 20-cent line. One of the other participants offered an over/under prop on the highest score at the end of the season. His line was a profit of 8.5 units. Let’s assume the season has not started yet, and that the participants are experienced sports bettors. What do you think of that line, and how would you analyze it?
The big question to ask yourself with a prop like this is what is the probability that a given pick will end in a win, loss, or push. From my section on betting the NFL, we can see that 2.8% of games fall right on the line. Let’s just say 3%, to keep it simple. Let’s call p the probability of a win, given that the bet was resolved. For a purely random picker, p would obviously be 50%. It is easy to improve upon that by only picking underdogs. As my previously mentioned page shows, over 25 seasons flat betting underdogs would have resulted in a win rate of 51.5%. It is also easy to improve upon that a bit more by cherry picking the softest lines against the market in general. Between those two, I think it isn’t hard to get to 52%. So I’m going to take it on faith that these guys can at least get as far as 52%.
So, assuming 52% of resolved bets win, the overall probabilities are:
Win: 50.44%
Draw: 3.00%
Loss: 46.56%
Using basic statistics, it is easy to see that the expected win per pick, laying -110, is -0.0078. The standard deviation per pick is 1.0333. The expected win over 70 picks is -0.5432, and the standard deviation is 701/2×1.0333 = 8.6452. A win of 8.5 units is 9.0432 units above expectations, or 9.0432/8.6452=1.0460 standard deviations to the right of expectations on the Gaussian Curve. I think we can ignore the adjustment for a discrete distribution because of the pushes, and some games not being -110/-110, will result in a fairly smooth curve down the a factor of 0.05 units.
So, the probability of any one player finishing more than 1.046 standard deviations above expectations is 14.77%. That figure can be found in any table of the Gaussian curve, or with the formula =1-normsdist(1.046) in Excel. The probability of all six players finishing under 1.046 is (1-0.1477)6=38.31%. Thus, the probability of at least one player finishing above 1.046 standard deviations up is 61.69%. That makes the over look like a solid bet laying -110. I show it is fair at -161.
The following table shows the probability of the over 8.5 winning given various values of p. Perhaps the person setting the prop was assuming a value closer to 51% for p.
NFL Handicapping Prop
| Prob. Correct Pick | Prob. Over Wins |
| 50.0% | 41.16% |
| 50.5% | 46.18% |
| 51.0% | 51.33% |
| 51.5% | 56.53% |
| 52.0% | 61.69% |
| 52.5% | 66.72% |
| 53.0% | 71.52% |
What do you think about that Patriot’s call of going for 1st down when they are 4th down on their own 28 yard line — and they are leading by 6 points ?! What is the odds of making a first down in that situation, and what would you have done?
For the benefit of other readers, this refers to a Nov 15, 2009 game in which the Patriots were up by six points over the Colts. There was 1:57 left in the fourth quarter, it was fourth down and about 1.5 yards, and the ball was on the Patriots’ 28 yard line. Patriots’ coach Bill Belichick made the now controversial decision to seal the victory and go for the first down on fourth and short, rather than kick the can down the road and punt.
There is a good column about this in the Las Vegas Review Journal. It quotes professional gambler and fellow actuary Steve Fezzik as saying that the odds favored going for the first down. I agree completely. In general, I think that other coaches punt too often, and too afraid of taking risks. To argue my position I asked fellow math head and sports bettor Joel B., who is much better than me at analyzing football odds mid-game. He offered the following odds:
- Patriot’s probability of making the first down: 60%
- Patriot’s probability of winning, given they make the first down: 100%
- Patriot’s probability of winning, given they miss the first down: 50%
- Patriot’s probability of winning, given they punt: 75%
So, the probability of winning by going for the first down is 60%×100% + 40%× 50% = 60% + 20% = 80%. That is greater than the 75% by punting.
The Monday morning quarterbacks can vilify Belichick all they want, but I applaud his decision. He shouldn’t be judged by the outcome of the game, but by whether or not the odds favored what he did at the time. I strongly feel that they did. A week later in the Ravens/Steelers game the Ravens went for it on 4th and 5, and made it. Although it was a different kind of situation, I’ve yet to hear anybody second-guess that decision.
In the interests of fairness, I am providing a link to an article taking the opposite point of view, titled Belichick’s fourth-and-reckless by Bill Simmons at ESPN.com
Suppose there are two football games that I feel have a player advantage. Let’s say each has a 55% chance of winning, and I have to lay 110. Which is more profitable, to bet the games straight up or as a single parlay?
Good question. Straight up, the advantage per wager is 0.55×(10/11) - 0.45 = 0.05. As a parlay, the advantage is (0.55)2×((21/11)2-1)-(1-(0.55)2) = 10.25%. So, it would seem the parlay is the way to go to maximize advantage.
However, the variance is greater as a parlay. If you are following the Kelly Criterion, then you will have to protect your bankroll for the parlay with a smaller wager. In this example, the optimal Kelly bet straight up is 5.48% of bankroll if the two games overlap, 5.50% if you first game ends before you bet on the second game, and 3.88% for the parlay. Multiplying the wager times the advantage, we get 0.00275 straight up (based on a 5.50% advantage) and 0.00397 for the parlay. Thus, the parlay results in the greater profit.
I considered the general case for this kind of question, looking also at 3-team and 4-team parlays and money line wagers. Assuming a small advantage for all bets, as a rule of thumb, if the probability of each event winning is less than 33%, then you should bet straight up. If each probability is between 33% and 52%, then you should do a 2-team parlay. If each probability is between 52% and 64%, then you should do a 3-team parlay. If each probability is greater than 64%, then you should do a 4-team parlay. If you are doing straight up wagers, then you are about equally well off doing 2-team or 3-team parlays, again assuming you have an advantage to begin with.
I should stress that if you are a recreational gambler going against a house edge (what sports bettor will admit to that?), then betting straight up minimizes the house advantage.
What is the probability of making a 2-point conversion in the NFL?
From the 2000 to 2009 NFL seasons, not including the 2009 post-season, there were 567 failed 2-point conversion attempts, and 318 successful attempts. Going by that, the probability of success is 318/(567+318) = 35.9%.
I really like the nice compact guides at your Wizard of Vegas site. I also have a question about the sports betting guide. The board pictured has no total or money line for a couple of the games, so I assume the casino was not offering those bets. Is that related to the size of point spread or is there some other reason they are not there?
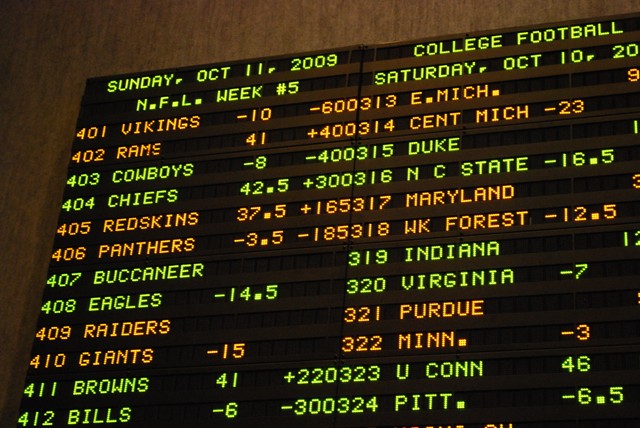
That picture was taken at a Leroy’s franchise, which is a small and conservative sports book. They tend to put out the spread first, and later the total and money lines.
It is also unusual to offer money lines on significantly lopsided games, for example the Eastern Michigan vs. Central Michigan with a 23-point spread. It is difficult to set accurate money lines with such games, and the risk of unbalanced action is greater. The best casino for betting money lines on games with big spreads is the Hilton. Finally, if the point spread is very small, like 1 or 1.5, then most sports books don’t bother to post a money line at all, because betting against the spread would likely result in the same outcome.
This question was raised and discussed in the forum of my companion site Wizard of Vegas.
Thank you for the opportunity to win an autographed copy of your book by predicting the exact score of the Super Bowl. However, isn’t the expected value pretty low? I figure the probability of winning is about 1 in 300.
I think the odds are better than that with a good educated guess. Here is my basic strategy for picking the exact outcome of any NFL game.
- Using the total and spread, estimate the total points of each team. For example, if we use a total of 57 and a spread of -5 for the Super Bowl, letting c=Colts points, and s=Saints points then...
(1) c+s=57
(2) c-5=s
Substituting equation (2) in equation (1):
c+(c-5)=57
2c-5=57
2c=62
c=31
s=31-5=26
The problem with stopping here is sometimes you get values that are unlikely to be scored by a single team. For example, the probability of a single-team total of 24 is 6.5%, but the probability of 25 is only 0.9%. The table below shows the single-team total probability, based on the 2000-2009 seasons. So we’re going to estimate the total points for each team based on realistic combinations of field goals and touchdowns.
- Assume the favorite kicks 2 field goals.
- Assume the underdog kicks 1 field goal.
- Subtract the field goal points from each. In the Super Bowl example, this would leave Colts = 25 touchdown points, Saints = 23 touchdown points.
- Divide touchdown points by 7, to get estimated touchdowns. c=3.57 TD, s=3.29 TD
- Round the estimated touchdowns to the nearest integer. c=4, s=3.
- Following this method, we get for total points c=(4×7)+(2×3)=34, s=(3×7)+(1×3)=24.
Using this method on all 6,707 games from the 1983 through the 2009 seasons would have resulted in 69 correct picks, for a success rate of 1.03%. The last time it would have been right was the Titans/Colts game in week 13 of 2009. That game had a spread of Colts -6.5, and a total of 46. The score was Titans 17, Colts 27.
One critic thought a better and simpler strategy would be to pick the nearest significant one-team total for both teams. Using such a method resulted in 51 wins only, for a win rate of 0.76%. In my opinion, splitting the field goals 2 and 1 between the stronger and weaker teams is important.Single-Team Totals in the NFL2000-2009 Seasons
| One-Team Total | Total in Sample | Probability |
| 0 | 93 | 1.75% |
| 1 | 0 | 0.00% |
| 2 | 0 | 0.00% |
| 3 | 148 | 2.79% |
| 4 | 0 | 0.00% |
| 5 | 2 | 0.04% |
| 6 | 114 | 2.15% |
| 7 | 210 | 3.96% |
| 8 | 9 | 0.17% |
| 9 | 76 | 1.43% |
| 10 | 316 | 5.96% |
| 11 | 9 | 0.17% |
| 12 | 49 | 0.92% |
| 13 | 289 | 5.45% |
| 14 | 238 | 4.49% |
| 15 | 55 | 1.04% |
| 16 | 170 | 3.21% |
| 17 | 373 | 7.03% |
| 18 | 33 | 0.62% |
| 19 | 92 | 1.73% |
| 20 | 368 | 6.94% |
| 21 | 234 | 4.41% |
| 22 | 64 | 1.21% |
| 23 | 218 | 4.11% |
| 24 | 347 | 6.54% |
| 25 | 47 | 0.89% |
| 26 | 103 | 1.94% |
| 27 | 282 | 5.32% |
| 28 | 159 | 3.00% |
| 29 | 52 | 0.98% |
| 30 | 127 | 2.39% |
| 31 | 242 | 4.56% |
| 32 | 23 | 0.43% |
| 33 | 57 | 1.07% |
| 34 | 164 | 3.09% |
| 35 | 76 | 1.43% |
| 36 | 27 | 0.51% |
| 37 | 68 | 1.28% |
| 38 | 108 | 2.04% |
| 39 | 11 | 0.21% |
| 40 | 21 | 0.40% |
| 41 | 62 | 1.17% |
| 42 | 31 | 0.58% |
| 43 | 6 | 0.11% |
| 44 | 24 | 0.45% |
| 45 | 33 | 0.62% |
| 46 | 1 | 0.02% |
| 47 | 7 | 0.13% |
| 48 | 28 | 0.53% |
| 49 | 15 | 0.28% |
| 50 | 1 | 0.02% |
| 51 | 5 | 0.09% |
| 52 | 7 | 0.13% |
| 53 | 0 | 0.00% |
| 54 | 2 | 0.04% |
| 55 | 1 | 0.02% |
| 56 | 4 | 0.08% |
| 57 | 1 | 0.02% |
| 58 | 1 | 0.02% |
| 59 | 1 | 0.02% |
| Total | 5304 | 100.00% |
This question was raised and discussed in the forum of my companion site Wizard of Vegas.
What is the probability of an onside kick being successful in the NFL before the 4th quarter. I mean, the move in the Super Bowl was absolutely brilliant, but did the Saints coach have the stats to back up his decision, or was he just going on a hunch?
According to an outstanding article at advancedfootballanalytics.com, the historical probability of success is 26%. However, with most onside kicks, the other team is expecting it, which lowers the probability of success. For surprise onside kicks, the probability of success is 60%! The thrust of the article is that smart strategy would be to do surprise onside kicks more often. I agree; it was a brilliant move by the Saints.
This question was raised and discussed in the forum of my companion site Wizard of Vegas.
What dynamics affect football totals betting as the season goes on, the weather gets worse, and there is more information on teams’ recent performance? How easy (or difficult) is it to find errors in the line?
To help answer this question, I graphed average points scored by the week number in the NFL, based on every season from 1983 to 2009. The following graph shows the results.
As you can see, the line goes up and down a lot. The thin black line is a least-squared best fit line, which shows a general trend upward. So as the seasons progresses, and temperatures drop, average points scored increases slightly, but that could easily be random variation.
That is about as far as I can take it. For a general opinion about how weather affects sports betting in general, I turned to my friend Jason Been, who is an expert on the topic. Here is what he said:
In most cases, wind is the predominant aspect of weather that most affects a game; but, it is not the only one. In baseball and other outdoor sports, shadows can have an equal affect, especially during early- and late-season baseball afternoon games. Rain or snow isn’t as big of a factor as most people think in football, as it generally affects both the offense and defense equally. An example would be a defensive back against a wide receiver. The rain and snow would slow them down equally, thus giving neither side an edge. Wind can simply eliminate a passing game in football along with kicking. I have seen games where a passing team has been forced to run the ball almost every play due to a strong crosswind. It doesn’t happen often, but on occasion the wind is the ultimate decider of a game.This question was raised and discussed in the forum of my companion site Wizard of Vegas.
In the NFL, on average, what is the probability after a score that the other team is the next to score?
Based on the 2000-2009 NFL seasons, the answer is 57%.
If an NFL team was soundly beaten its last game, is it better to bet on them, or against them, their next game? Same question for a huge victory. I keep hearing that after a big loss a team will "have something to prove," while a team with a big win may be overconfident and lazy. Any truth to that?
I show after a 21 point loss or more the team will cover the spread 51.66% of the time. However, that is well within the margin of error. The following table shows the outcomes against the spread of the last game, according to the win or loss by the same team the previous game. The results never stray far from 50% and are always within a standard deviation of it. Basically, I find no statistical correlation between the win/loss against the spread and how many points the team won or lost by the previous game.
Win, Loss, or Tie Against Spread According to Margin of Victory or Defeat the Previous Game
| Previous Game Outcome | Win Against Spread | Loss Against Spread | Tie Against Spread | Win Ratio | Standard Deviation |
| Win by 21 or more | 233 | 247 | 17 | 48.54% | 2.28% |
| Win by 14 to 20 | 235 | 219 | 11 | 51.76% | 2.35% |
| Win by 10 to 13 | 188 | 180 | 8 | 51.09% | 2.61% |
| Win by 7 to 9 | 198 | 181 | 12 | 52.24% | 2.57% |
| Win by 4 to 6 | 164 | 170 | 12 | 49.10% | 2.74% |
| Win by 3 | 202 | 212 | 14 | 48.79% | 2.46% |
| Loss by 2 to win by 2 | 184 | 188 | 14 | 49.46% | 2.59% |
| Loss by 3 | 209 | 207 | 12 | 50.24% | 2.45% |
| Loss by 4 to 6 | 174 | 163 | 9 | 51.63% | 2.72% |
| Loss by 7 to 9 | 187 | 195 | 9 | 48.95% | 2.56% |
| Loss by 10 to 13 | 173 | 189 | 14 | 47.79% | 2.63% |
| Loss by 14 to 20 | 220 | 232 | 15 | 48.67% | 2.35% |
| Loss by 21 or more | 249 | 233 | 15 | 51.66% | 2.28% |
Table based on every NFL game from week 1 of the 2000 season to week 4 of the 2010 season.
Pinnacle sportsbook just went to posting their odds in decimal format. How do I convert sports book odds from the decimal format to the American format?
Let’s look at the October 25, 2010 Monday Night Football game as an example. The European odds are posted as:
New York Giants 2.750
Dallas Cowboys 1.513
Both figures represent what you will get back for one unit wagered if you win, including your original wager. When the decimal odds are greater than or equal to 2, then the translation is easy: just subtract one, and then multiply by 100. If the odds are less than 2, then (1) subtract 1, (2) take the inverse, and (3) multiply by -100.
For those of you who prefer a formula, if the decimal odds pay x, here is the calculation for the equivalent American odds:
If x>=2: 100*(x-1)
If x<2: -100/(x-1)
In the example above, the lines in the American format are:
New York Giants: 100*(2.750-1) = +175
Dallas Cowboys: -100/(1.513-1) = -195
You can also automatically convert all the lines by selecting "American Odds" in the pulldown menu in the upper left of Pinnacle’s web site, above the logo.
I made a bet with a friend who used to book that I could beat the spread on 50% or more of every regular season game this upcoming NFL year. If I win, I get $1000. If he wins, I pay $500. Through Sunday 10/31/10 I am up 19 games and he is talking about a deal. What would be a good offer to take here?
Outstanding bet, like taking candy from a baby. It’s like getting 2 to 1 on a coin flip. Even better, since you would win on a tie.
At the time of this writing, 95 games have been played out of 256 in the regular season. Using the binomial distribution, I show your probability of winning is 99.87%. A fair settlement price would be $998.02.
This question was raised and discussed in the forum of my companion site Wizard of Vegas.
A sports book in Las Vegas posted an obviously incorrect total in college football. The market number was 43, but they offered it at 53. So I bet the under about 20 times for small amounts, so as not to draw attention, or move the line. As expected, I won. Now I’m nervous about presenting the bets for payment. Would the casinos be justified in refusing to pay?
I would lay 10 to 1 you'll get paid, although they may have a few words with you first. The reason I have some doubt is a sports book can rescind a wager that was obviously made in error, with permission of the Gaming Control Board.
"A book may not unilaterally rescind any wager without the prior written approval of the chairman." -- Nevada Regulation 22.115
While this right exists, based on anecdotal evidence, it is very seldom invoked. Let me know what happens.
p.s. I was notified later by the questioner that he was paid without much trouble.
There is a Super Bowl bet on the number of Scrabble points in the last name of the first player to score a touchdown. The line is 10½ and -115 on both the over and under. Is either side a good bet?
I like creative bets like this. It can be found at the Boyd casinos, as well as the Palms, El Cortez, and South Point. To answer the question I looked at another set of bets on the specific player to score the first touchdown. Those odds are shown in the second column of the table below. For the sake of simplicity, I’m ignoring the field at 5-1, and no touchdown scored at 100-1. I then converted those wins to the &lquo;fair probability” in the third column, meaning the probability of winning you would need for the bet to be exactly fair. These probabilities are inflated, due to depressing what each win pays, which is why the sum is 166%. The “adjusted probability” in the fourth column shows the fair odds divided by 1.660842, so that the total probability is 100%. The fifth column shows the number of Scrabble points in each player’s name. The “expected Scrabble points” in the sixth column is the product of the probability and Scrabble points. The lower right cell shows the mean Scrabble points is 14.18521.
Going by the mean, the over looks to be the right side. Going player by player, the probability of 11 or more Scrabble points is 0.641894, which converts to a fair line of -179. So that makes the over at -115 an outstanding bet. Laying 115, the player has a 20% advantage on the over.
Unfortunately, by the time I went to bet it the line had moved to -180.
Scrabble Points in First Player to Score a Touchdown in Super Bowl
| Name | Posted Odds | Fair Probability | Adjusted Probability | Total Scrabble Points | Expected Scrabble Points |
|---|---|---|---|---|---|
| Mendenhall | 4 | 0.200000 | 0.120421 | 20 | 2.408416 |
| Jennings | 4.5 | 0.181818 | 0.109473 | 22 | 2.408416 |
| Starks | 5 | 0.166667 | 0.100351 | 10 | 1.003507 |
| Wallace | 7 | 0.125000 | 0.075263 | 15 | 1.128945 |
| Ward | 8 | 0.111111 | 0.066900 | 8 | 0.535204 |
| Rodgers | 8 | 0.111111 | 0.066900 | 10 | 0.669005 |
| Nelson | 8 | 0.111111 | 0.066900 | 9 | 0.602104 |
| Miller | 10 | 0.090909 | 0.054737 | 11 | 0.602104 |
| Driver | 10 | 0.090909 | 0.054737 | 11 | 0.602104 |
| Jones | 12 | 0.076923 | 0.046316 | 15 | 0.694735 |
| Roethlisberger | 12 | 0.076923 | 0.046316 | 22 | 1.018945 |
| Sanders | 15 | 0.062500 | 0.037632 | 9 | 0.338684 |
| Brown | 18 | 0.052632 | 0.031690 | 12 | 0.380276 |
| Redman | 18 | 0.052632 | 0.031690 | 11 | 0.348587 |
| Quarless | 20 | 0.047619 | 0.028672 | 19 | 0.544761 |
| Kuhn | 25 | 0.038462 | 0.023158 | 12 | 0.277894 |
| Jackson | 30 | 0.032258 | 0.019423 | 24 | 0.466145 |
| Moore | 30 | 0.032258 | 0.019423 | 8 | 0.155382 |
| Totals | 1.660842 | 1.000000 | 14.185214 | ||
Unfortunately, by the time I went back to the casino to bet it the line had moved to -180.
P.S. Hours before the game I got in a bet at -170. Unfortunately, it lost. The first player to score a touchdown was Jordy Nelson. Nelson has 9 Scrabble points.
How did the underdogs do against the spread during the NFL the 2010-2011 season?
In the 267 games played, the favorite beat the spread 128 times, the underdog won 133 times, and 6 games landed on a push. Of bets resolved, the underdog won 51.0%.
What is more interesting is the overs and unders. The over won 148, the under 114, and 5 landed on a push. Of bets resolved, the over won 56.5% of the time. The probability of the under winning 114 games or less out of 262 resolved is 2.1%.
In the Rams vs Cardinals game of November 6, 2011 the Rams scored two safeties in the third quarter. What are the odds of that?
The probability of at least one safety per game is 5.77%, based on historical experience.
The expected number of safeties per game would be -ln(1-0.0577) = 0.0594.
The expected number per quarter per team would be 0.0594/8 = 0.0074.
The probability of exactly two safeties by the same team in a single quarter would be e-0.0074×0.00742/fact(2) = 1 in 36,505.
In an NFL season there are 267 games, and 267×8=2,136 team quarters. So, according to my estimate, this will occur on average once every 36,505/2,136 = 17.1 years.
This should be considered as just a rough guess. There are factors to the game that I'm not taking into account, in the interest of simplicity.
Have you heard the story of Princess, the camel at the Popcorn Park zoo in New Jersey, who has an 88-51 record against the spread in handicapping the NFL? What are the odds of that?
Not counting pushes, the probability of getting at least 88 wins out of 139 picks is 0.00107355, or 1 in 931. This is pretty underwhelming. I'm sure there are 930 other animals out there who did worse that nobody writes about. For more information on Princess, read the article N.J. camel predicts Giants over Patriots at ESPN.com.
Thanks for your new section on parlay cards. I used your advice and got these lines (the market point spread is in parenthesis):
- Bills +3.5 (+3)
- Chargers +7.5 (+7)
- Cardinals -2.5 (-3)
- Dolphins -2.5 (-3)
- Bears +2.5 (0)
What is my advantage on this bet?
I'm going to assume the odds are 25 for 1, which is available on the half point card at the Golden Nugget, South Point, and William Hill sports book families.
The table below shows the line you got and the market price line.
First, the probability of an underdog beating the spread is 51.6%. That equates to a fair line of -106.6 on the underdog. So, you're getting 6.6 basis points on the underdogs, and losing them on the favorites.
Second, my table on buying a half point in the NFL shows the fair price to pay for each extra half point. For example, getting the extra half point off of 3 is worth laying -121.4, or 21.4 basis points.
The table breaks down how many basis points you're getting. For the Bears, I doubled the basis points for 1 and 2, since you're turning a loss into a win if you cross those numbers.
The table then converts the total basis points to a probability of winning. The formula is p = (100+b)/(200+b), where p = probability of winning and b = number of basis points.
The bottom row takes the product of each leg winning, for a probability of winning the parlay of 0.046751. At odds of 25 for 1, that bet has an expected return of 0.046751*25-1=0.168783. In other words, a 16.9% advantage. Well done!
Rudeboyoi Parlay Card
| Team | Parlay Card |
Fair | Underdog Basis Points |
Total Extra Points |
Total | Probability |
|---|---|---|---|---|---|---|
| Bills | 3.5 | 3 | 6.6 | 20.8 | 27.4 | 0.560246 |
| Chargers | 7.5 | 7 | 6.6 | 11.9 | 18.5 | 0.542334 |
| Cardinals | -2.5 | -3 | -6.6 | 20.8 | 14.2 | 0.533147 |
| Dolphins | -2.5 | -3 | -6.6 | 20.8 | 14.2 | 0.533147 |
| Bears | 2.5 | 0 | 0 | 18.0 | 18.0 | 0.541321 |
| Product | 0.046751 | |||||
Did you hear about the car dealership in Seattle that had to pay $420,000 because the Seahawks shutout the Giants? I read they had to pay $7,000 for the insurance policy against that. What would have been a fair premium?
According to the article Washington car dealership paying out $420,000 after Seahawks shutout, the dealership ran a promotion to pay twelve winners $35,000 each if the Seahawks shut out the Giants in the week 15 game, played on December 15, 2013. The article goes onto say that the dealership paid $7,000 for an insurance policy to pay in said event in case it actually happened.
Based on every NFL game from the 1983 to 2012 seasons, a specific side of any given game was shut out. However, as a seven-point underdog, in a game with an average over/under, I would argue the probability of the Giants being shutout were higher than average. The over/under in that game was 41. Let's do a little algebra to solve for the expected number of Giants points.
Let:
s=Seahawks points
g=Giants points
We know that s+g=41 and s=g+7, based on the point spread and over/under total.
Substituting the second equation into the first:
(g+7) + g = 41
2g +7 = 41
2g = 34
g = 17
Next, let's look at the probability of a shutout by the estimated number of points of each team, based on the 1983 to 2012 seasons. I skipped any rows where the sample size was zero.
Probability of Shutout
| Estimated Points |
Sample Size | Shutouts | Ratio |
|---|---|---|---|
| 5.25 | 1 | 0 | 0.0% |
| 6.50 | 1 | 0 | 0.0% |
| 7.75 | 1 | 0 | 0.0% |
| 8.00 | 1 | 0 | 0.0% |
| 8.25 | 3 | 0 | 0.0% |
| 8.50 | 2 | 0 | 0.0% |
| 8.75 | 2 | 0 | 0.0% |
| 9.00 | 2 | 0 | 0.0% |
| 9.50 | 4 | 0 | 0.0% |
| 9.75 | 6 | 1 | 16.7% |
| 10.00 | 10 | 1 | 10.0% |
| 10.25 | 7 | 0 | 0.0% |
| 10.50 | 14 | 2 | 14.3% |
| 10.75 | 7 | 1 | 14.3% |
| 11.00 | 13 | 1 | 7.7% |
| 11.25 | 21 | 1 | 4.8% |
| 11.50 | 22 | 3 | 13.6% |
| 11.75 | 23 | 1 | 4.3% |
| 12.00 | 34 | 2 | 5.9% |
| 12.25 | 36 | 7 | 19.4% |
| 12.50 | 41 | 3 | 7.3% |
| 12.75 | 39 | 4 | 10.3% |
| 13.00 | 55 | 1 | 1.8% |
| 13.25 | 58 | 5 | 8.6% |
| 13.50 | 78 | 1 | 1.3% |
| 13.75 | 89 | 5 | 5.6% |
| 14.00 | 92 | 4 | 4.3% |
| 14.25 | 108 | 7 | 6.5% |
| 14.50 | 117 | 8 | 6.8% |
| 14.75 | 141 | 7 | 5.0% |
| 15.00 | 160 | 7 | 4.4% |
| 15.25 | 160 | 7 | 4.4% |
| 15.50 | 213 | 7 | 3.3% |
| 15.75 | 198 | 11 | 5.6% |
| 16.00 | 206 | 6 | 2.9% |
| 16.25 | 221 | 12 | 5.4% |
| 16.50 | 241 | 10 | 4.1% |
| 16.75 | 273 | 7 | 2.6% |
| 17.00 | 306 | 8 | 2.6% |
| 17.25 | 305 | 8 | 2.6% |
| 17.50 | 306 | 10 | 3.3% |
| 17.75 | 323 | 4 | 1.2% |
| 18.00 | 299 | 8 | 2.7% |
| 18.25 | 332 | 8 | 2.4% |
| 18.50 | 309 | 9 | 2.9% |
| 18.75 | 307 | 7 | 2.3% |
| 19.00 | 356 | 8 | 2.2% |
| 19.25 | 389 | 5 | 1.3% |
| 19.50 | 361 | 5 | 1.4% |
| 19.75 | 343 | 6 | 1.7% |
| 20.00 | 402 | 8 | 2.0% |
| 20.25 | 379 | 6 | 1.6% |
| 20.50 | 359 | 3 | 0.8% |
| 20.75 | 353 | 5 | 1.4% |
| 21.00 | 344 | 1 | 0.3% |
| 21.25 | 317 | 3 | 0.9% |
| 21.50 | 341 | 2 | 0.6% |
| 21.75 | 331 | 1 | 0.3% |
| 22.00 | 369 | 1 | 0.3% |
| 22.25 | 336 | 0 | 0.0% |
| 22.50 | 316 | 2 | 0.6% |
| 22.75 | 280 | 3 | 1.1% |
| 23.00 | 311 | 1 | 0.3% |
| 23.25 | 290 | 3 | 1.0% |
| 23.50 | 279 | 1 | 0.4% |
| 23.75 | 255 | 1 | 0.4% |
| 24.00 | 246 | 1 | 0.4% |
| 24.25 | 219 | 0 | 0.0% |
| 24.50 | 230 | 2 | 0.9% |
| 24.75 | 230 | 1 | 0.4% |
| 25.00 | 212 | 2 | 0.9% |
| 25.25 | 207 | 0 | 0.0% |
| 25.50 | 176 | 1 | 0.6% |
| 25.75 | 154 | 0 | 0.0% |
| 26.00 | 154 | 1 | 0.6% |
| 26.25 | 113 | 0 | 0.0% |
| 26.50 | 137 | 0 | 0.0% |
| 26.75 | 122 | 0 | 0.0% |
| 27.00 | 95 | 0 | 0.0% |
| 27.25 | 98 | 0 | 0.0% |
| 27.50 | 83 | 0 | 0.0% |
| 27.75 | 81 | 0 | 0.0% |
| 28.00 | 82 | 0 | 0.0% |
| 28.25 | 55 | 1 | 1.8% |
| 28.50 | 56 | 0 | 0.0% |
| 28.75 | 51 | 0 | 0.0% |
| 29.00 | 48 | 0 | 0.0% |
| 29.25 | 34 | 0 | 0.0% |
| 29.50 | 24 | 0 | 0.0% |
| 29.75 | 25 | 0 | 0.0% |
| 30.00 | 24 | 0 | 0.0% |
| 30.25 | 21 | 0 | 0.0% |
| 30.50 | 18 | 0 | 0.0% |
| 30.75 | 23 | 0 | 0.0% |
| 31.00 | 16 | 0 | 0.0% |
| 31.25 | 15 | 0 | 0.0% |
| 31.50 | 8 | 0 | 0.0% |
| 31.75 | 3 | 0 | 0.0% |
| 32.00 | 6 | 0 | 0.0% |
| 32.25 | 7 | 0 | 0.0% |
| 32.50 | 6 | 0 | 0.0% |
| 32.75 | 3 | 0 | 0.0% |
| 33.00 | 4 | 0 | 0.0% |
| 33.25 | 6 | 0 | 0.0% |
| 33.50 | 5 | 0 | 0.0% |
| 34.75 | 4 | 0 | 0.0% |
| 35.00 | 2 | 0 | 0.0% |
| 35.50 | 1 | 0 | 0.0% |
| 36.00 | 2 | 0 | 0.0% |
| 36.25 | 1 | 0 | 0.0% |
| 36.50 | 1 | 0 | 0.0% |
| 37.25 | 1 | 0 | 0.0% |
| 37.75 | 2 | 0 | 0.0% |
| 42.25 | 1 | 0 | 0.0% |
The next steps are too involved to explain here, but I developed a formula for the probability of a shutout, given the number of estimated points.
p = Estimated points.
x = 1.562545 -0.302485 * p
probability of shutout = ex/(1+ex)
The following chart shows the actual and estimated probability of a shutout for 14 to 22 points.
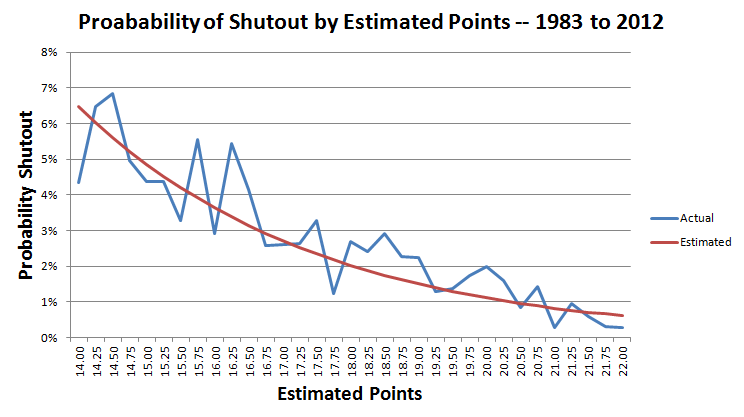
In the game in question the Giants expected to score 17 points.
Using the formula above the table:
x = 1.562545 -0.302485 * 17 = -3.579706
Probability of a shutout = exp(-3.579706)/( exp(-3.579706)+1) = 2.71%. To be exact, 0.0271275.
Given that the dealership would have had to pay $420,000 in the event of a Giants shutout, the fair cost of the policy would have been $420,000 × 0.0271275 = $11,394. Normally insurance companies that insure unusual promotions like this double the fair cost, so I would have expected to see a premium of $22,788. So, the $7,000 premium the dealership paid was a steal. Assuming the boss reviews the math, I wouldn't want to be in the shoes of the whoever calculated that $7,000 premium.
This question was raised and discussed in my forum at Wizard of Vegas.
Who offers the best futures odds in Vegas?
According to futures bets on the 2015 Super Bowl, here is the average house edge at various Vegas sports book groups.
House Edge in Sports Futures
| Sports Book | House Edge |
|---|---|
| CG Technology | 21.90% |
| William Hill | 26.63% |
| Wynn | 27.96% |
| Caesars | 35.49% |
| Stations/El Cortez | 38.33% |
| Golden Nugget | 39.75% |
| MGM | 40.88% |
| Boyd/Coast | 49.35% |
| TI | 57.93% |
To calculate the average house edge on any set of futures bets, please use my Sports Futures Calculator.
I hear that Jerry's Nugget no longer offers the juicy odds for NFL teasers. Is this true?
Sadly, it is. Jerry's Nugget was the last place to offer the liberal odds of -110 on a 2-leg 6-point NFL teaser, +180 for three legs, and +300 for four legs. By doing Wong teasers (crossing the 3- and 7-point margins of victory), this was a solid advantage play.
You can find all the current parlay and teasers odds around Vegas at my sports book survey at Wizard of Vegas.com.
For more on football teasers in general, please see my page on Teaser Bets in the NFL.
In the NFL is it a good bet to take over 50 at one sports book and under 52.5 at another?
You can use my alternative totals in the NFL for this kind of question. That will show the probability and fair line for getting extra points on a total bet.
Let's assume that the fair over/under line is 51. The first table shows that the probability of winning betting under 52.5 is 54.4%, assuming no tie. The third table shows that the probability of winning betting over is 53.5%.
To beat the 10% juice, you need to have a probability of winning of 11/21 = 52.38%. The average of these two bets is 53.95%, so, yes, play that middle. Your advantage is 3.0%.
As I write this question, just after the regular NFL season, Bovada is giving 18 to 1 odds on the Carolina Panthers winning the NFC championship. They are already six-point favorites to win the first game against Arizona. Just two more to go after that.
Don't you think I could lock in a win betting Carolina to win the NFC and hedging along the way, betting the money line on whoever they play?
No! Futures and betting favorites on the money line are two of the worst bets you can make when betting football. This sounds like a betting system, adding a sequence of negative bets and expecting the sum to be positive. However, I will probably need more than that to convince you, so let's look at the numbers.
First of all, the Panthers are only in the playoffs because they are the least bad team in an awful division (the NFC South). Their record is 7-8, and they have given up 35 more points than they have scored all season.
If they are so bad, why are they six point favorites against the Arizona Cardinals, you might ask? Arizona made the playoffs mostly on the efforts of Carson Palmer in the first six games. He was injured in the sixth game, but they still managed to squeak into the playoffs anyway. Plus, Carolina enjoys home field advantage.
Given that Carolina is a six-point favorite against Arizona, I show their probability of winning that game is 70.3%.
Assuming they win, they will mostly likely have to beat both Green Bay and Seattle to win the NFC. What are the odds of beating those two teams? Keep in mind, given the playoff rules, they will be the visiting team both times.
There is an easy way to get a close estimate of the point spread in any game. Here is my Wizard formula for the point spread on the home team:
(Net points per game of away team) - (Net points per game of home team) - 2.67.
Let's look at a hypothetical match-up between Arizona and Green Bay.
During the 2014 season, Carolina has -35 net points all season. For Green Bay, it is +138. Divide both numbers by 16, because there are 16 played games in the season, for an average margin of victory per game of:
Carolina: -2.1875
Green Bay: +8.6250
Using my formula, the home team, Green Bay, should have a spread of -2.1875 - 8.6250 - 2.67 = -13.4825.
So, Green Bay would be about a 13.5-point favorite against Carolina. I'll skip the math over this step, but I show the probability of Carolina winning as a 13.5-point underdog is 14.3%.
Seattle has just about as strong a record as Green Bay, with 140 net points all season. So Carolina would also have about a 14.3% chance of winning that game.
The odds of Carolina winning all three games are 70.3% × 14.3% × 14.3% = 1.44%. So, a fair futures bet at that probability is 68.6 to 1!
Yes, you could argue that Detroit or Dallas might get lucky and make the Conference Championship. You could also argue that the odds of Carolina beating Green Bay and Seattle are positively correlated. However, those are minor considerations against the fact that my rough fair line is 68.6 and you're getting only 18.
You also have to consider the expense of betting the favorites on the money line as you go. This is generally an awful bet. Square bettors love to bet big favorites on the money line, creating value in the other direction. It is roughly a fair bet to take underdogs of seven points or more on the money line, meaning that the favorite bettors are paying all the juice.
Let's be generous and assume you could get +250 on Arizona and lay 5 to 1 in the following two games. Let's also say you bet $100 on Carolina at 18 to 1.
First, you bet $40 on Arizona at +250 as a hedge. If they win you win $100 on that bet and lose $100 on the futures bet and break even.
If Carolina beats Arizona you bet $700 to win $140 on Seattle. If Seattle wins, which they should, you'll be up $140, which will recoup your losses on Arizona and the futures bet, so you'll be even.
If Carolina should upset Carolina you will have to bet $4,200 to win the $840 you will have lost betting on Arizona, Seattle, and the futures bet. If Carolina loses, you'll be even. If they win you'll be down $40+$700+$4,200=$4,940. The $1,800 you'll win on the futures bet will not be enough to recoup that.
In closing, your idea of taking Carolina to win the NFC and hedge along the way is highly ill-advised.
What is your advice for suicide pools?
For those who don't know, a suicide pool is a last-man-standing contest, generally based on the NFL, although any sports league will do. Here are the fundamental rules.
- Every player pays the same amount to play.
- Every week every player must predict the winner of one game that week. All games are scored straight up, not against the spread.
- If a player is ever wrong he is immediately eliminated from the contest.
- No player may choose the same team more than once.
- The last man standing wins the pot.
There may be additional rules, like the person running the pool getting a cut, and splitting the pot once it gets down to a few people, if and only if by mutual agreement.
Before going further, here are the results from last season from officefootballpool.com.
Office Football Pool — 2014 Season
| Week | Team | Spread | Picks |
|---|---|---|---|
| 1 | Phil | -10.5 | 54 |
| 1 | Chic | -7 | 29 |
| 1 | Pit | -6.5 | 14 |
| 1 | Det | -6 | 6 |
| 1 | KC | -3 | 5 |
| 1 | NYJ | -5.5 | 5 |
| 1 | NE | -4 | 1 |
| 1 | SF | -4.5 | 1 |
| 1 | StL | -3.5 | 1 |
| 2 | Den | -12.5 | 38 |
| 2 | GB | -8 | 23 |
| 2 | NO | -6.5 | 7 |
| 2 | SF | -7 | 5 |
| 2 | TB | -5.5 | 3 |
| 2 | Wash | -6 | 2 |
| 2 | Cin | -5.5 | 1 |
| 2 | NE | -5.5 | 1 |
| 3 | NE | -14 | 44 |
| 3 | NO | -10 | 16 |
| 3 | Atl | -6.5 | 3 |
| 3 | Cin | -6.5 | 1 |
| 3 | Ind | -6 | 1 |
| 4 | SD | -13 | 34 |
| 4 | Ind | -7.5 | 20 |
| 4 | Pit | -7.5 | 10 |
| 4 | Bal | -3 | 1 |
| 5 | NO | -10 | 21 |
| 5 | GB | -8 | 13 |
| 5 | Den | -7.5 | 6 |
| 5 | Det | -6.5 | 5 |
| 5 | Phil | -6.5 | 3 |
| 5 | Dal | -6.5 | 2 |
| 5 | Pit | -6 | 2 |
| 5 | SD | -6.5 | 1 |
| 5 | Sea | -7 | 1 |
| 5 | SF | -5 | 1 |
| 6 | Sea | -8.5 | 21 |
| 6 | Den | -9.5 | 13 |
| 6 | SD | -7 | 7 |
| 6 | Cin | -6.5 | 5 |
| 6 | Ten | -4 | 2 |
| 6 | Atl | -3 | 1 |
| 6 | SF | -3 | 1 |
| 7 | NE | -9.5 | 9 |
| 7 | Sea | -6.5 | 9 |
| 7 | GB | -6.5 | 3 |
| 7 | Bal | -6.5 | 2 |
| 7 | Buf | -5.5 | 2 |
| 7 | Wash | -5 | 2 |
| 7 | Dal | -6.5 | 1 |
| 8 | Dal | -9.5 | 12 |
| 8 | KC | -7 | 5 |
| 8 | Clev | -7 | 1 |
| 8 | Mia | -6 | 1 |
| 9 | SF | -10 | 3 |
| 9 | Cin | -10.5 | 2 |
| 9 | Sea | -14.5 | 2 |
| 10 | Bal | -9.5 | 2 |
| 10 | Cin | -6 | 1 |
| 10 | Sea | -9 | 1 |
| 11 | GB | -5.5 | 1 |
| 11 | Mia | -6 | 1 |
| 11 | NO | -7 | 1 |
| 12 | Ind | -14 | 2 |
| 13 | Bal | -6.5 | 1 |
| 13 | Det | -7 | 1 |
| 14 | NO | -10 | 1 |
The "picks" column refers to the number of players who picked that team.
Note that not once did anybody ever pick an underdog. In the 497 picks made, the average point spread was 9.3.
I do not know why they recorded a pick in week 14, because there was only one player left at that point.
Based on this study of other player behavior, here is my basic strategy for suicide pools. These are all just general guidelines and not hard and fast rules that you must follow every week.
- Remember that your enemy is the other players. Don't focus too much on handicapping the NFL but on beating your competition.
- Don't pick the biggest favorite. That is what most other people will do. Hopefully that big favorite will lose and the field will be significantly thinned down. You want to be a survivor rather than a victim when a huge favorite loses.
- Don't forget the rule that you can't pick the same team twice. That said, you can't always pick great teams. At times you should pick average teams playing awful teams, to preserve the easy wins on the best teams.
- Don't bother handicapping. Just use the point spread as an indicator of your chances to win any given pick.
- If a week has exactly two huge favorites, I would avoid both of them. Remember that you're trying to balance picking games likely to win while not following the masses. As a very general rule, I think picking the third highest spread is a good idea, especially if you're not wasting one of the best teams.
This question is raised and discussed in my forum at Wizard of Vegas.
What is your opinion on how the new rules for the point after a touchdown will affect half point parlay cards?
For the benefit of other readers, one item in my bag of tricks is taking advantage of extra half points off of point spreads of 3 and 7 on half-point parlay cards. I've shown this to be a reliable, although very volatile, advantage play.
The new rule moves back the extra kick to the 15-yard line. This should lower the probability of success of the kick and induce more two-point conversion attempts. With more two-point conversion attempts, whether successful or not, there should not be as many games decided by three or seven points, thus lowering the value of getting the extra half point off these key numbers on half point parlay cards. Should we be worried? Let's see.
First, we should worry, but necessarily for this reason. Other rule changes have hampered the aggressiveness of the defense, leading to higher scoring games. The following graph shows the average number of points scored per game for each season from 1994 to 2014.
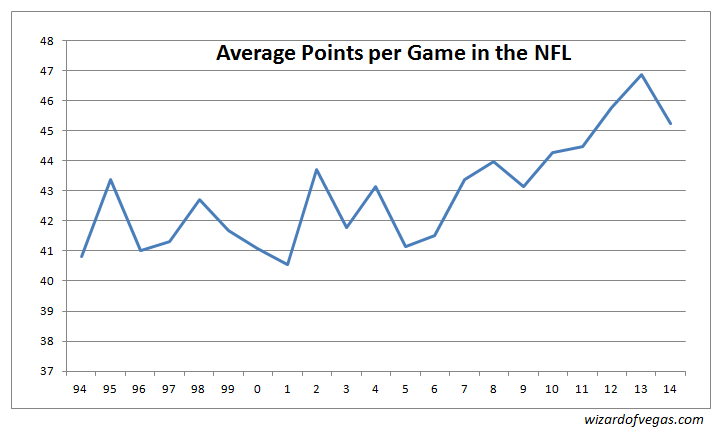
As the graph shows, the average points per game held close to 42 through 2006. However, starting in 2007, the average has been going up by about half a point per year. This leads to the question of whether this increase in the average score tends to flatten out the margin of victory distribution, especially for the magic numbers of 3 and 7. The next graph shows the probability of a three- and seven-point margin of victory by year.
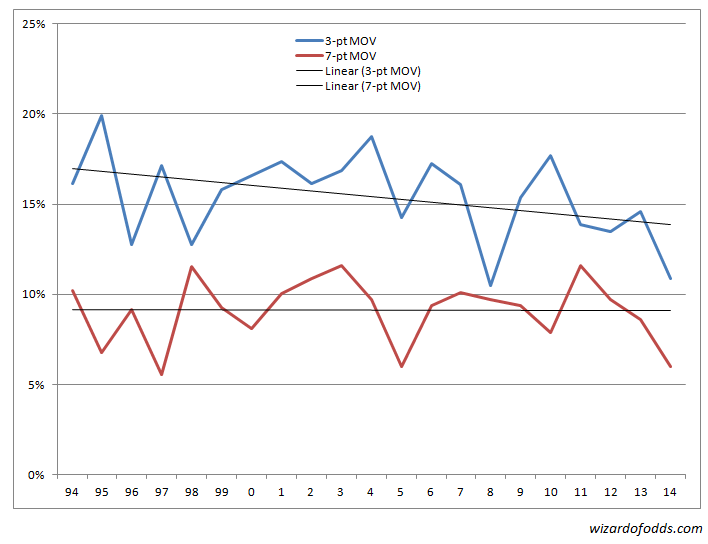
As you can see, the probability of a seven-point margin of victory is holding steady at 9.1%. However, the probability of a three-point margin of victory has been steadily declining, especially since 2004. This is bad because there are so many points spreads of three in the NFL.
Whatever the cause of the fewer three-point margins of victory, the value of the half point parlay cards is declining. Is it going to get even worse with the new extra point rule?
My answer is that it should hurt but not by much. Before the rule change, I calculate about 4.8% of touchdowns were followed by a two-point conversion attempt. As I write this, there have only been two weeks of games played since the rule change. In the first two weeks of the 2015 season, there were 167 touchdowns and 15 were followed by a two-point conversion attempt, for an attempt rate of 9.0%.
Mathematically speaking, I think going for the two-point conversion should be much more common, especially for variance-seeking weaker teams, and I don't understand why it isn't. That isn't what you asked, but I just had to get it off my chest.
Let's say, for the sake of example, I can go 54% against the spread consistently. For the sake of growing my bankroll as fast as possible, which would be fatter, flat betting of three-team parlays paying 6 to 1?
Good question. Your advantage laying 11 to 10 is 3.09% and on the parlay is 10.22%. That would seem to make a great case for the parlay.
However, remember that the optimal strategy for bankroll growth with any advantage play is to use the Kelly Criterion. According to Kelly, the optimal bet size is that which maximizes the expected log of the bankroll after the bet. For bets with just two possible outcomes, the optimal bet size is conveniently the advantage divided by what the bet pays on a "to one" basis.
Straight bets pay 10 to 11. That would make the optimal bet size 0.030909/(10/11) = 0.034000. At a player advantage of 3.09%, you can expect to win 0.001051 times your bankroll per game straight betting.
The optimal bet size on the parlay is 0.102248/6 = 0.017041. At a player advantage of 0.102248, you can expect to win 0.001742 times your bankroll per game straight betting .
However, straight betting is better because you get to bet three times. So multiply the expected gain per bet of flat betting by three to get 3 × 0.001051 = 0.003153. This is 81% more than the bankroll growth of parlay bets.
If your bankroll is so great that you bump against maximum bet limits, then you probably should make a parlay bet first, which tend to not move lines, and then get in your straight bets.
This question is raised and discussed in my forum at Wizard of Vegas.
As you know, the extra point must now be attempted from the 15-yard line in the NFL, which the two-point conversion attempt remains at the two-yard line. Do you think this changes the calculus in the decision? In other words, what is the correct play now?
It is a borderline call, which I think is what the NFL was after when they changed the rule. Things that should be considered in making the decision are:
- Probability of success by kicking.
- Probability of success by going for the two-point conversion.
- Overall chances of each team winning.
Late in the game, it is also critical to consider the key numbers. For example, if it is very late in the game and you just scored a touchdown to put your team ahead by three points, then you should kick. If you make it, you will be up by four points and force the other team to score a touchdown to win. If you go for two points, and miss, the other team can tie with only a field goal. So, I am going to limit my discussion to early in the game, when key numbers are not a big factor.
To answer your question, I wrote a simulation program. While it is rather crude, I think it is fairly accurate at reflecting the nature of the NFL in terms of field goals, touchdowns, and turnovers.
According to the article What Effect Will Moving Extra Points to the 15 Yard Line Have? by Kevin Rudy, the probability of making the extra point from the 15-yard line is 94.2%. I put into my program 94%, to keep the numbers nice and round.
There is more disagreement on the probability of making a two-point conversion. It would seem obvious this would also vary significantly according to the particular defense and offense. What I did was run simulations at two-point conversion success of 46% to 50%, in groups of 1%.
In each simulation, I had one team always kick and the opponent go for the conversion at each probability of success. I also ran simulations where both teams always kicked, to have something to compare the two-point conversion results against.
Table 1 below shows the results of two equally skilled teams. Team A always kicks after a touchdown. The table shows the probability team B winning and average additional points scored per game according to whether team B kicks or goes for the two-point conversion (2PC) and its probability of success.
Table 1 — Equal Teams
| Team B Strategy |
Team B Prob. Win |
Avg. Additional Points |
|---|---|---|
| Kick | 50.00% | 0.0001 |
| 2PC -- 46% | 49.76% | 0.0491 |
| 2PC -- 47% | 49.90% | 0.0000 |
| 2PC -- 48% | 50.05% | 0.0492 |
| 2PC -- 49% | 50.19% | 0.0980 |
| 2PC -- 50% | 50.33% | 0.1461 |
Note that with a probability of success of 47%, the expected additional points is 0.94 whether kicking or going for two points. However, the probability of winning is 0.1% less going for two points. I figure that is because if you miss, then the other team has the chance to tie with two field goals. It should be noted that this key number effect is quite small but does favor being conservative and kicking, all other things being equal. The bottom line is, with two equal teams, the probability of success with the two-point conversion should be at least 49% to go for it.
Table 2 below shows the results of two unequal teams, where team A is stronger. Team A always kicks after a touchdown. It shows the same statistics as table 1 above.
Table 2 — Team A Stronger
| Team B Strategy |
Team B Prob. Win |
Avg. Additional Points |
|---|---|---|
| Kick | 28.83% | -7.0039 |
| 2PC -- 46% | 29.01% | -7.0519 |
| 2PC -- 47% | 29.16% | -7.0039 |
| 2PC -- 48% | 29.30% | -6.9568 |
| 2PC -- 49% | 29.45% | -6.9083 |
| 2PC -- 50% | 29.60% | -6.8595 |
Table 2 shows the weaker team should go for the two-point conversion at all listed probabilities of success. Even at 45%, where the expected number of total points scored is less. Why is this, you might ask. This is because in any game, the weaker team should seek variance and the stronger team should abhor it.
Table 3 below shows the results of two unequal teams, where team B is stronger. Team A always kicks after a touchdown. It shows the same statistics as tables 1 and 2 above.Table 3 — Team B Stronger
| Team B Strategy |
Team B Prob. Win |
Avg. Additional Points |
|---|---|---|
| Kick | 71.17% | 7.0042 |
| 2PC -- 46% | 70.53% | 6.9349 |
| 2PC -- 47% | 70.67% | 7.0030 |
| 2PC -- 48% | 70.82% | 7.0725 |
| 2PC -- 49% | 70.97% | 7.1412 |
| 2PC -- 50% | 71.12% | 7.2109 |
Note that table 3 shows a probability of team B winning equal to 71.17% by kicking. It is less than that for all probabilities of success shown, even though the expected number of points is greater at a probability of success of 49% or 50%. The reason, again, is that weak teams should seek variance and strong ones should avoid it. The two-point conversion attempt adds volatility to the game, which is why weaker teams should be more inclined to attempt them, all other things being equal, than strong teams.
What are the odds of the Carolina Panthers going 16-0 in the regular season? Are either of these bets good?
Yes +425?
No -550?
I have a method to estimate the point spread for any given game that comes remarkably close to the actual spread, barring any major injuries, healings, suspensions, or things like that. Here is the formula for expected points scored by any given team:
[(Average offensive points) + (Average points allowed by opposing team)]/2 + (1.5 if playing at home, otherwise -1.5).
The point spread will be (Expected visiting team points) - (Expected home team points).
Let's look at the week 13 game against the Saints as an example. The Panthers are the visiting team. The Panthers have scored 32.3 offensive points per game on average this season. The Saints have given up 30.8 per game, on average. Using my formula, the Panthers can expect to score (32.3+30.8)/2 - 1.5 = 30.05 points.
Then, do the same for the Saints. They have scored 23.7 offensive points per game on average this season. The Panthers have given up 18.6 per game, on average. My formula yields (23.7 + 18.6)/2 + 1.5 = 22.65 points scored by the Saints.
Therefore, the Panthers can expect to win by 30.05 - 22.65 = 7.4 points.
Next, use my Prop Bet Calculator to determine the probability of winning each game. My calculator will ask for the over/under on the game, but I find for who will win straight up the only thing that really matters is the spread. For the total just put in an NFL average this season of 46. You'll see that for a point spread of 7.4 the fair line of the home team winning is +271. That means the fair line on the Panthers is -271. That equates to a probability of winning of 271/371 = 73.05%.
Then just do that for the other four games and take the product. Or you can just use the table below.
Panthers Weeks 13 to 17
| Week | Opposing Team |
Location | Expected Panther Points |
Expected Opponent Points |
Panthers Winning Margin |
Panthers Fair Line |
Probability Win |
|---|---|---|---|---|---|---|---|
| 13 | Saints | Away | 30.05 | 22.65 | 7.4 | -271 | 0.730458 |
| 14 | Falcons | Home | 28.3 | 19.6 | 8.7 | -323 | 0.763593 |
| 15 | Giants | Away | 27.05 | 23.85 | 3.2 | -154 | 0.606299 |
| 16 | Falcons | Away | 25.3 | 22.6 | 2.7 | -144 | 0.590164 |
| 17 | Buccaneers | Home | 30.35 | 19.05 | 11.3 | -458 | 0.820789 |
Taking the product of the probability column you get the probability of winning all five games, which is 0.163813. That corresponds to a fair line of +510. So, neither of those lines you quoted are good.
This question was raised and discussed in my forum at Wizard of Vegas.
What was that last play in the first half of the Panthers/Saints game in week 13 of the 2015 season?
I believe it is referred to as a "point after touchdown return." Per a rule change effective this season, if an attempted kick after a touchdown fails, with the opposing team scoring a touchdown, then it shall count as two points for the scoring team. Prior to the 2015 season, it would have been a dead ball. This was the first, and so far only, such score in NFL. You can see a video of it at YouTube.
This question was raised and discussed in my forum at Wizard of Vegas.
As you probably know, 16-seed UMBC beat 1-seed University of Virginia in the NCAA basketball championship tournament. This has never happened before in the 34-year history of March Madness in its present format. How does this affect the probability of filling out a perfect bracket.
After adjusting my model for that game and all others in the 2018 season, I get a probability of a perfect bracket of 1 in 42,743,890,552. You can read my strategy and how I arrived at that figure in my page Probability of a Perfect Bracket.
How do I convert odds in sports betting back and forth between the American and European ways of expressing them?
Let's let a be the odds expressed the American way and e the European way.
To go from American to European:
If a>0, then e=1+(a/100).
If a<0, then e=(a-100)/a.
To go from European to American:
If e>=2, then a=100×(e-1).
If e<2, then a=100/(1-e).
I've seen proposition bets at William Hill sports books on whether any Major League Baseball game will have a Grand Slam on a given day. What is the fair probability and line on this by the number of games played?
For the benefit of other readers, here are the lines for a Grand Slam for May 11, 2019. The column headings should say "yes" and "no," not "home" and "away."
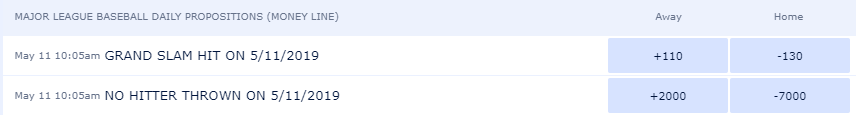
To answer this question, I looked at every MLB game from the 2011 to 2018 seasons. In those eight seasons, there were 858 Grand Slams over 19,440 games. That makes the average number of Grand Slams per game 0.0441. This is not the same as the probability any given game will have a Grand Slam, because one game can have more than one. Using the Poisson distribution, the probability of any given game having at least one Grand Slam is 4.3176%.
With that probability it is easy to create the following table showing the probability and fair line for at least one Grand Slam by number of games.
Grand Slam Probability
| Games | Probability Grand Slam |
Fair Line |
|---|---|---|
| 1 | 4.32% | 2216 |
| 2 | 8.45% | 1084 |
| 3 | 12.40% | 706 |
| 4 | 16.18% | 518 |
| 5 | 19.80% | 405 |
| 6 | 23.27% | 330 |
| 7 | 26.58% | 276 |
| 8 | 29.75% | 236 |
| 9 | 32.78% | 205 |
| 10 | 35.68% | 180 |
| 11 | 38.46% | 160 |
| 12 | 41.12% | 143 |
| 13 | 43.66% | 129 |
| 14 | 46.09% | 117 |
| 15 | 48.42% | 107 |
| 16 | 50.65% | -103 |
I must add a caveat that my answer is based on MLB averages. For any given day, the player should factor in the specific games being played. In particular, the higher the over/under lines, the greater the chances of a Grand Slam.
A number of sports books, like the MGM in New Jersey, are offering a truly free bet — if the bet looses, they refund in CASH you can then withdraw. Like a 100% loss rebate for slots, but applied to sports betting. What kind of bet should I make under this promotion?
With any free-roll like this, you should shoot for the moon. If they allow parlays, then parlay bet as much as they allow under this promotion and parlay enough events to get up to whatever their maximum payout is, which in Las Vegas is typically around $100,000.
If you have to bet on a single event, then find the biggest long-shot you can.
As an example of why this strategy is best, consider the same promotion in double-zero roulette with a $100 bet. If you make an even-money bet, then the expected amount you'll get back is (18/38)×$200 + (20/38)×$100 = $147.37. However, if you bet on a single number, then you can expect to get back (1/38)×$3600 + (37/38)×$100 = $192.11.
I saw a promotion at an online sports book where a money line bet in the NFL would automatically be graded a winner if the chosen team was up by 17 or more points. What is the value of this?
This promotion will turn what would otherwise be a losing bet into a winner if the chosen team is up by 17 or more points and then loses. A good example of such a situation is a bet on the Atlanta Falcons in Super Bowl 51. At one point, in the third quarter, the Falcons were up 28 to 3, a lead of 25 points. However, they went onto lose 28 to 34.
To answer this question, I looked at 4,131 games played in every NFL season from 2000 to 2015. The following table shows the greatest deficit the winning team had during the course of the game. The probability column filters out the five games that ended in a tie.
Greatest Deficit Overcome
| Deficit | Games | Probability |
|---|---|---|
| Tie | 5 | 0.000000 |
| 0 | 1804 | 0.437227 |
| 1 | 100 | 0.024237 |
| 2 | 29 | 0.007029 |
| 3 | 560 | 0.135725 |
| 4 | 235 | 0.056956 |
| 5 | 23 | 0.005574 |
| 6 | 131 | 0.031750 |
| 7 | 622 | 0.150751 |
| 8 | 39 | 0.009452 |
| 9 | 34 | 0.008240 |
| 10 | 195 | 0.047261 |
| 11 | 84 | 0.020359 |
| 12 | 14 | 0.003393 |
| 13 | 49 | 0.011876 |
| 14 | 104 | 0.025206 |
| 15 | 10 | 0.002424 |
| 16 | 6 | 0.001454 |
| 17 | 36 | 0.008725 |
| 18 | 14 | 0.003393 |
| 19 | 2 | 0.000485 |
| 20 | 4 | 0.000969 |
| 21 | 22 | 0.005332 |
| 22 | 0 | 0.000000 |
| 23 | 2 | 0.000485 |
| 24 | 5 | 0.001212 |
| 25 | 1 | 0.000242 |
| 26 | 0 | 0.000000 |
| 27 | 0 | 0.000000 |
| 28 | 1 | 0.000242 |
| Total | 4131 | 1.000000 |
The "Tie" row represents the five games in the 16 seasons that ended in a tie, so let's not count those. The "0" row represents the 43.7% of games where the winning team was never behind.
The table shows 87 games saw a team losing by 17 or more and then went onto win. Over the 4126 games resolved (i.e. not counting the five ties), this probability is 2.11%.
Given these situations would flip a loss to a win, we double this probability to get a value of 4.22%. The house edge on money line bets is about the same as bets against the spread at 4.76%. Subtracting 4.22%, we get a very low house edge of 0.54% under this promotion.
Now that March Madness 2023 is over, how has your probability of a perfect bracket and expected wins by seed changed?
My strategy for a perfect bracket is to pick the higher seeded team (meaning a lower seed number) in every game. At the end, when it gets to 1 vs. 1 seed, pick randomly. Based on 38 seasons of data. Here are some probabilities for each possible game:
- 1 vs. 16 seed = 99.31%
- 2 vs. 15 seed = 93.06%
- 3 vs. 14 seed = 84.72%
- 4 vs. 13 seed = 78.47%
- 5 vs. 12 seed = 64.58%
- 6 vs. 11 seed = 62.50%
- 7 vs. 10 seed = 60.42%
- 8 vs. 9 seed = 51.39%
To survive the first round, you would need to win all eight of the games listed above four times each. The probability of that is 1/4354.
Here are the various matchups in round 2, assuming you make it that far using this strategy.
- 1 vs. 8 seed = 80.00%
- 2 vs. 7 seed = 69.51%
- 3 vs. 6 seed = 60.00%
- 4 vs. 5 seed = 56.00%
To survive the second round, you would need to win all four of these games listed above four times each. The probability of that is 1/811.
Here are the various matchups in round 3, assuming you make it that far using this strategy.
- 1 vs. 4 seed = 73.44%
- 2 vs. 3 seed = 60.71%
To survive the second round, you would need to win both of these games listed above four times each. The probability of that is 1/54.
In round 4 there will be 1 vs. 2 seed games. The probability of the 1 seed winning is 53.73%. The probability of that happening four times is 0.53734 = 0.112355.
In round 5, there will be two 1 vs. 1 games. The probability of winning each is 1/2, so the probability of winning two is 1/4.
In round 6, there will be one 1 vs. 1 games. The probability of winning is 1/2.
Taking the product of all these probabilities results in a probability of a perfect bracket of 1 in 13,569,150,522.
To answer your other questions, here are the average wins per team, by seed.
- 1 seed = 3.29 average wins
- 2 seed = 2.32 average wins
- 3 seed = 1.85 average wins
- 4 seed = 1.55 average wins
- 5 seed = 1.16 average wins
- 6 seed = 1.07 average wins
- 7 seed = 0.9 average wins
- 8 seed = 0.74 average wins
- 9 seed = 0.59 average wins
- 10 seed = 0.61 average wins
- 11 seed = 0.63 average wins
- 12 seed = 0.51 average wins
- 13 seed = 0.25 average wins
- 14 seed = 0.16 average wins
- 15 seed = 0.11 average wins
- 16 seed = 0.01 average wins