Wizard Recommends
-
 $11000 Welcome Bonus
 -
 $3000 Welcome Bonus
 -
 UP TO $777 BONUS
Sports - Other Games
How do you read the odds on the board at the racetrack? For example what does 20-5 pay if you bet $20 to win?
I don’t think the board would say "20-5" but rather reduce the ratio to 4-1. That means that the bet will pay 4 to 1. So you will win 4 times your bet, plus get the original bet back, if you win. Thus a $20 wager at 4-1 would win $80. When you take the ticket to the window they will give you $100 ($80 winnings plus original $20 bet returned).
When wagering on a greyhound race, they give odds on each dog such as "9-2, 7-2, 10-1" what do the numbers represent?
The 9-2 means that a $2 bet would win $9. So if you bet $2 you would get back $11, $9 in winnings plus the original $2. Likewise, the 7-2 bet would win $7 for a $2 bet, and 10-1 means a $1 bet would win $10.
Hello. I found your site very informative. Will you be providing any analysis on other sports like hockey betting and more on baseball in the future (such as o/u, selecting the best puck-line, etc)?
I do plan to add more on sports betting in the future. That is where I’m personally focusing most of my gambling energy. However I haven’t found a good angle to exploit yet in baseball or hockey but hopefully I’ll think of something.
At Pinnacle Sports there is a "Multi-Way calculator on the right" that shows the house edge on money line bets. What is the formula they are using?
This is interesting. Normally the house edge is lower betting on the favorite, as I explain in my sports betting appendix 3. However at Pinnacle they evidently set the money lines so that each has the same house edge. Let d be the money line on the dog and f be the money line on the favorite. For example if the money lines were +130 and -150 then d=130 and f=-150. The house edge on both bets at Pinnacle would be:
1-(1+(d/100))*(1-(100/f))/(2+(d/100)-(100/f))
The amount you must bet to get back one unit is 1/[(d/100))*(1-(100/f))/(2+(d/100)-(100/f))].
For example with money lines of +130 and -150 the house edge on both bets would be 3.3613% and the expected return on a bet of 1.034783 units would be 1 unit.
At a land casino, I would assume the fair set of money lines to be +140 and -140 in this example, resulting in a house edge of 2.78% on the favorite and 4.17% on the dog. All other things being equal this would suggest that Pinnacle is a good place to bet on underdogs.
If I determine the fair line of a game to be -160/+160 and I find a rogue line of -145 what is my EV? Any formula you could provide in which I could derive my EV +/- after a fair line has been determined would be greatly appreciated.
Let p be the probability of the favorite winning. If -160 is a fair line then:
100*p - 160*(1-p) = 0
260p = 160
p = 160/260 = 8/13 = 61.54%.
So the expected return on a $145 bet at a -145 line would be (8/13)*100 + (5/13)*-145 = 75/13 = $5.77. So the player advantage would be $5.77/$145 = 3.98%.
Let’s define t as the true money line with no house edge and a as the actual money line. Following are the formulas for the player’s expected return:
A is negative, t is negative: (100*(t-a) / (a*(100-t))
A is positive, t is positive: (a-t)/(100+t)
A is positive, t is negative: (a*t + 10000)/((t-100)*100)
So in your case your expected return is 100*(-160 -(-145))/(-145*(100-(-160))) = 3.98%.
I bet on the Internet on soccer games. The games are supposed to start at 10am but I was able to make my bets at 10:25. All my bets were accepted at 10:25. So if the bets are accepted there is nothing we can do about it. The Internet casino doesn’t have a right to cancel those wagers, they are supposed to pay my winnings.
First, the vast majority of Internet gambling is unregulated. So there is likely no higher authority you can turn to. The word of the casino/sport-book is final. I would imagine that somewhere in their lengthy terms and conditions is a rule that says that wagers made after the beginning of an event are not official, even if accepted by the system. Even without that most have a general rule that if a line is obviously in error then even if the system accepts it can be voided. Such I think could be the situation here.
Millennium Sports offers a 6-point 2-team teaser at even odds. I’d like to see the teaser page updated with these odds. Plus I’d like to see another table that states what percentage of individual bets you’d have to win to break even. I calculate the 2 team 6 point teaser witheven odds to be 75% to break even. A difficult task.
I just updated my Sport Betting Appendix 4 to include the Millennium teasers, as well as using more recent data. Here are is the house edge on teasers including the Millennium odds and whether the pick is on a team or the total.
Two Team 6-Point Teasers
| Pays | Team | Total |
| -120 | 12.85% | 18.12% |
| -110 | 9.25% | 14.74% |
| Ev | 4.92% | 10.68% |
Two Team 6.5-Point Teasers
| Pays | Team | Total |
| -110 | 5.85% | 10.41% |
| -120 | 9.58% | 13.97% |
| -130 | 12.74% | 16.98% |
To answer your question, to beat the 6-point teaser you would need an overall probability of winning of greater than 50%, so per pick the probability of covering the tease would need to be the square root of 0.5, which equals 70.71%. To beat the 6.5-point teaser the probability per bet would be 52.38%, or 0.52380.5=72.37% per pick.
People have a misconception that sports betting limits in Vegas are really high, which in my experience only applies to football and not always in that case. Could you tell me the approximate limits in Vegas sports books on the 4 major sports? Thank you for your time.
I don’t count hockey as a major sport because it gets very little action. I’m told that the Coast casinos have the highest limits. There is no maximum set in stone that I know of but they take large bets on a case by case basis. Here is what I think they would probably take on the average game.
NFL side: $50,000
NFL total: $5000
MLB money line: $10,000
MLB total: $2000
NBA side: $10,000
NBA total: $2,000
In the NBA, there are three divisions per conference, and 8 teams per conference make the playoffs. The top 3 seeds in each conference are the respective division winners, and the #4 through #8 seeds are the non-division winners with the best records. This year, 2 teams from the same division in the Western Conference, the Spurs and Mavericks, have the top record in the West. If this keeps up, it means that the 2nd best team in the Western Conference will end up with the #4 seed and will have to face the best team in the 2nd round if they both win. Many people are pointing to this as a problem with the system, while the NBA considers it an anomaly. In an effort to explain that its not an anomaly because it could happen frequently, an analyst from ESPN recently made the following statement in a blog: "There are 15 teams in each conference, and five teams in each of the three divisions. That means that there's a 4-in-14 chance that the team with the second-best record will be from the same division as the team with the best record." Is he correct that there is a 4/14 chance of it happening in a particular conference? How would you figure this out? If he is correct, than it would happen in at least 1 of the conferences 57% of the time, right?
Yes, he is right. There are combin(15,2)=105 ways to choose the two best teams out of 15. There are 3*combin(5,3)=30 ways to choose them from the save division. So the probability the two best teams are from the same division is 30/105 = 4/14. The probability of this happening in at least one conference is 1-(10/14)2 = 48.98%.
A reader wrote in to express his comments about the assumptions I made in my answer. Here is a link to his commentary.
All other things being equal, in particular temperature and pressure, can a kicker kick a ball further in low or high humidity?
Physics is not my strong subject so I asked two physics experts, my father and Andrew N., this question. Both agree the ball will go further if the humidity is high. Here is how Andrew N explained why.
Interesting question. I looked up a few bits of data on the internet, and it looks like the ball will go further on a humid day than on a dry day, everything else being equal. The two factors that are most relevant are: 1) the air density; and 2) air viscosity.
1) Air Density
Contrary to popular belief, humid air is lighter than dry air. This is because the water molecules take up the same space but weigh less than the O2/N2 mixture. Lighter air results in less buoyant force on the football because the football is displacing less mass. However, the density of dry air at 20 C and 700 kPa(*) is 8.33 kg/m3, and with 42.1% relative humidity at the same temperature and pressure the density is 8.32 kg/m3 according to the sources listed, a difference of about 1/10th of 1%. So this isn't going to effect the distance much.
(*) - 700 kPa is a high pressure, but it's the only data I could find. However, in engineering terms it's not much different from normal atmospheric pressure so I believe the properties listed in the data will be applicable to the situation at normal atmospheric pressure (101.325 kPa).
2) Air viscosity
Viscosity is the force that contributes to skin drag on the football. A lower viscosity will contribute less to drag, resulting in a longer flight. For dry air at 20 C and 700 kPa, the dynamic viscosity is 18.3 Pa*s, while for the air with 42.1% humidity the viscosity is only 17.8 Pa*s. This is a difference of about 3%, again not much but a little more significant than the effect of air density. However, humid air will still contribute to a slightly longer football flight.
To see if this makes sense in the real world, I found a golf website that has some data on golfball flight distance in dry and humid conditions:
As you can see, in humid air the golfball goes further, but only by a yard or two at most. So humid air definitely results in a longer projectile (golfball or football) flight, but the effect is very slight.
Andrew N
Data culled from:
wipos.p.lodz.pl/HighTech/example1.html" (data on humid air at 20 C and 700 kPa). Link no wonder works.
physics.holsoft.nl/physics/ocmain.htm (calculators for humid air properties, Link no wonder works)
Wizard's comments: To add to the first point, Boyle’s Law says that given the same temperature, the volume of gas is inversely proportional to the pressure. So given the same temperature and pressure the volume of gas will be constant, in other words the same number of molecules per unit area. The atomic weight of oxygen is 16, nitrogen is 14, and hydrogen is 2. So a water molecule (H2O) has an atomic weight of 18, while O2 and N2 are much heavier at 32 and 28 respectively. So when it is humid the lighter water molecules push the heavier O2 and N2 molecules out of the way, causing for less resistance for the football to cut through the air.
How many possible combinations are there for the NCAA March Madness tournament. In other words had I wanted to cover every possible outcome for the 64 team tournament, how many differenct combinations would I have to cover. I have seen one answer that says it is 2 to the power of 64 which is 18.4 quintrillion. This number seems too large to me. I am a math major but don’t have my old probability book handy to figure out the combinations/permutations, so I thought I would ask the Wizard.
There are 63 total games (32+16+8+4+2+1). Each game has two possible outcomes. So the total number of ways the tournament could play out is 263 = 9,223,372,036,854,780,000.
In your answer to Edward from Placentia you say, "Square action on the money line tends to favor the favorite, creating value on the underdog." I’m not so sure this is usually the case. As you know, most small time gamblers like to risk a little to win a lot. This is achieved by betting the moneyline on the dog in these high profile games. While you were correct in your analyzation of the Super Bowl, I would urge you to look at this past NCAA Football championship game between USC and Texas. Tons of public money came in on Texas ML, while the spread stayed around 7. On gameday, both USC -185 and Texas +206 was available. I’m not really looking for an answer here, but I thought it might be something else for you to consider when betting sports in the future. Thanks for the great site!
I’m afraid I don’t know much about college basketball. However, I agree that gamblers prefer to get odds rather than lay them. Nevertheless, I still say that in the NFL square money usually falls behind the favorite. For this reason, in any given Super Bowl, the spread will not be in synch with the Money Line. As an example, the 2005 Super Bowl had a 7-point spread. Normally the money line on a 7-point favorite is -300. However, on New England it was around -250. My explanation is that Eagles fans were disproportionately betting the money line, while New England fans were giving up the 7 points, creating value for New England on the Money Line.
The regular baseball season is 162 games. If a team wins 92 games, it will probably make the playoffs. If the team has a 55% chance of winning each game, what are the odds that it will win exactly 92 games? What are the odds that it will win at least 92 games?
The probability of winning exactly 92 games and losing 70 is 162!/(92!×70!)×0.5592×0.4570 = 0.056868. To get the exact probability of winning at least 92 you would need to sum this formula for all wins from 92 to 162. The answer for at least 92 wins is 0.353239.
Do you have any opinions about presidential futures? I.e., betting on which candidate will win his/her primary or the general election? Is there any way of calculating the house edge? Would you ever consider making such wagers for real money? Personally, I think that watching the current betting lines may be better than polls to predict election results. Do you think there’s any validity to them?
Yes, I do indeed bet on elections. In 1996 I made my biggest bet to date on Clinton over Dole at even money. That was also one of the best bets I ever made. I have been betting every election ever since, most of the time against friends. At major online sites that take political bets, I think it is a close to efficient market. In other words, I think the market is basically right, and the odds can be used to estimate the probability of each candidate winning. Currently I think that TradeSports is a good source for election odds. As I write this, on September 29, 2007, the odds given equate to the following probabilities of victory.
Republican Primary
| Candidate | Probability |
| Giuliani | 40.0% |
| Thompson | 8.4% |
| Romney | 28.5% |
| Paul | 6.7% |
| McCain | 7.0% |
Democratic Primary
| Candidate | Probability |
| Clinton | 71.0% |
| Obama | 12.3% |
| Gore | 8.2% |
| Edwards | 4.9% |
Party to Win
| Candidate | Probability |
| Democrat | 63.0% |
| Republican | 35.8% |
| Other | 1.2% |
Hi, I was recently in Vegas and made a bet on an NCAA tournament game that ended after I left town (I won the bet). While the back of the ticket says I need to mail it registered mail, is this actually a requirement to get my money or do they just want you to send it with delivery confirmation so you can’t claim the casino lost the ticket?
I would take that as more of a suggestion, than a requirement. They have probably said that for decades, since before the post office had competition tracking mail. Nobody except the post office, including UPS and FedEx, will deliver to a post office box. However, for many of us, including me, the nearest post office is several miles away, and usually has a long slow line. For high-valued tickets I would look up the street address of the casino and use that, attention to the accounting department. For low-valued tickets ($200 or less) I would take my chances with a first class stamp, to the PO Box. Personally I have mailed in tickets three times, all of which had the registered mail rule. All three times I got a check within about two weeks. With two I used UPS, and one I used just a first-class stamp.
Great site. I notice you have a lot of information on historical betting spreads. I wanted to run some analysees on historical NBA spreads to test a theory. Any advice on where I can get the data?
Thanks. I get a lot of my data from Davler Sports. For college football, I use the free data at The Gold Sheet.
If all thirty major league baseball teams were of equal talent, then what would be the probability that any given team from a specified division would make the playoffs? Clearly the current rules favor the National League Central and disadvantage the American League West.
Why don’t teams in the American League West complain about this inequity? The differences here to me are not trivial. Since making the playoffs is big money for a team, I’m surprised that there aren’t more complaints from the NL Central. I would also be a little miffed, as a fan of any of these six teams, to know my team is getting the short end of the stick.
I can’t imagine that I’m the first one to ever notice this? Does MLB compensate these teams in some way?
For the benefit of other readers, there are two leagues, each with three divisions, in Major League Baseball. Each division has five teams, except the American League West, with 4, and the National League Central, with 6. Every year, in both leagues, the three division leaders, and a Wild Card team, make the playoffs. The Wild Card team is the team with the best win/loss record in the League, not counting the three division leaders. There are some tie-breaking rules, which I won’t get into, and assume they are resolved randomly.
Indeed, the American League West has a big advantage, and the National League Central has a big disadvantage, all other things being equal. I do not know of any compensating rules. Nor do I know the reason for this imbalance. Before 1998 there were only two divisions. In 1998, Major League Baseball added two new teams, the Tampa Bay Devil Rays and Arizona Diamondbacks. They also increased the number of divisions from four to six, and added the Wild Card rule. However, why they didn’t balance the leagues, I have no idea. The best solution to this inequity, in my opinion, would be to move the Houston Astros to the American League West. Some may say Houston is not west enough, but the Texas Rangers are also in that division.
I posted the answer and solution to the probability question at my companion site, mathproblems.info, as problem number 200.
p.s. Since I posted this column, one reader wrote that the reason for the imbalance was to keep the number of teams in each league an even number. This allows every team to play on a given day, and keep the play within the division. However, this I don’t buy as an excuse. In 2008 the regular season consisted of 162 games per team, played over 185 days (not counting the all-star game day, and a day on each side). So, each team played 0.8757 games per day. Of those 162 games, 18 are played against teams in the opposite division, and 144 in the same division. I suggest that with balanced divisions of 15 teams each, on any given day 12 teams play within their own league. Over 185 days, that will accomplish 185 × (12/15) = 148 games. In the other 37 days, schedule 14 interleague games, for a total of 162 games. So, the only change will be a reduction in the number of interleague games per team from 18 to 14. It seems to me, most fans oppose interleague games to begin with, including me.
p.p.s. Another reader wrote to say that my system would not accommodate the baseball traditions of keeping every team playing on Saturdays and Sundays, and designating interleague play to only certain times of the seasons. Okay, fair points. However, if tradition is so important in baseball, why introduce interleague games at all? Personally, I value fairness over tradition. Put me in charge of baseball scheduling, and I’ll no only balance the leagues, but keep every team playing on weekends. However, it would come at the expense of the days off being clumped together. Maybe the easier thing to do would be to add two more teams. My hometown of Las Vegas will be the first to volunteer to be one of them.
I have a follow-up question with regard to your page on betting on the NBA. You noted the low probability of a margin of victory of one point. Is this logical according to rules of probability? According to basketball-reference.com, teams usually have best players shooting 60% for 2-pointers and 40% for 3-pointers. It would therefore seem to me that coaches should go for the immediate win of a 3-pointer (and thus have 40% chance to win) rather than the 30% chance to win by a 2-pointer (60% chance of making, followed by 50% chance of winning in overtime).
This may be balanced by the fact that going for a 2-pointer in final seconds you are more likely to be fouled and get 2 easy points, but even still, the best foul shooters run around 85%, meaning a 72% chance of making both, followed by 50% chance of winning in overtime, for a total of 36%. What is your take on these this?
I hope you’re happy. My knowledge of basketball rules and strategy is pretty weak, so I asked some friends stronger than me in that area, and never got the same answer twice. Some answers were direct opposites of each other. Two theories I got out of the discussion are (1) the overall field goal percentage for the NBA is more like 50% (source), and (2) there is a chance going for a 2-point shot that the shooter will get fouled, and make the shot anyway. Sorry I can’t do better than that.
This article from abc.net.au is about a player who manipulated the odds on a dog race in Australia. Can you explain to me how he did it?
That is an interesting story. The betting terminology is a bit different in Australia. As I understand it, in Australia there are not separate bets for place and show, but just a place bet. The place bet will pay bettors on the first two dogs in races with seven or fewer dogs, and the first three dogs with eight or more total in the race. In the race in question, there were eight dogs, two of whom where strong favorites. Following is the general way the winning odds are calculated in a three-dog place pool in Australia, which is different from how the odds are calculated in the U.S..
- Take out the track cut from the total pool of place bets. For the sake of argument, let’s use the usual American take-out of 17%.
- Divide the rest into three pools.
- Pay the winners on each dog a pro-rata basis according to the size of the pool and the amount bet on the dog. If the amount bet on the dog exceeds its share of the pool, then bettors will get a refund.
Let’s look at an example. Suppose $100,000 is bet on place bets in an 8-dog race. Assume bets on the winning dogs total $5,000 on dog A, $10,000 on dog B, and $15,000 on dog C. First, the 17% take-out would be deducted, leaving $83,000. That would be divided by 3, leaving $27,667 to pay the winners of each dog. Winning bets on dog A would be paid $27,667/$5,000 = 5.53 for 1, before any rounding (I’m not sure how they round down under). Likewise, winning bets on dog B would be paid 27667/10000=2.77 for 1 and winning bets on dog C would be paid 27667/15000 = 1.84 for 1.
The bettor in this case exploited the rules by betting such huge amounts that he pretty much controlled the odds. For the sake of simplicity, let’s assume he was the only bettor. The article said he bet $350,000 on the two favorites and $5,000 on each additional dog. With six underdogs (pun intended), that resulted in a total pool of 2?$350,000 + 6?$5,000 = $730,000. After the take-out and split, there was $201,997 to the winners of each dog. The rule about getting at least a push resulted in bets on the two favorites being refunded, because $350,000 > $201,997. However, the share of the pool on the third dog was huge compared to wagers on it. The winning odds would have been 201,997/5000 = 40.4 to 1. So, the profit on the third dog was $5,000 ? 39.4 = $197,000. He actually only won $170,000, probably because of other bets on the third dog.
This technique would not work in the U.S., by the way, because in the U.S., we deduct the original wagers made on each winning dog from the total show pool and then add them back in after dividing by 3. This deduction would have caused the pools on the two favorites to be negative, resulting in just small winnings of the minimum $0.10 per $2 bet.
This question was raised and discussed in the forum of my companion site Wizard of Vegas.
I've been having a good laugh about Paul the Octopus and the "predictions" he’s been making. I tend to be a bit more analytical, and rely on math for my bets instead of an Octopus, but thought it was kind of cute and amusing anyhow.
I don’t suppose you have any thoughts on this? The reason I found it interesting was because the Octopus does seem to favor the German flag, perhaps because there’s other German flags in its aquarium setting. He’s also correctly picked the Serbia and Spain matches that Germany played. Are there any interesting mathematical odds or personal input you’d like to share in your next column or an article perhaps?
Paul’s record is 12 correct picks and 2 incorrect picks. The probability of getting exactly 12 out of 14 correct picking randomly is combin(14,12)×(1/2)14 = 0.56%. The probability of getting 12 or more correct out of 14 is (1+14+combin(14,2))×(1/2)14 = 0.65%. He was not given the choice of picking a tie, and there never was one in the games he handicapped. I’m not sure how his record would have been depicted if there were any ties, but I suspect they wouldn't have been included.
This is obviously dumb luck, possibly combined with some form of chicanery. While this may be fun, I don't consider it legitimate news. I think this story got more news coverage here than some civil wars in Africa.
This question was raised and discussed in the forum of my companion site Wizard of Vegas.
Apparently the LVH has a $10 ticket out for VCU to win the national championship at 5000:1. That would pay $50,000 should VCU win. *IF* you held the ticket, what is the minimum you would you accept in trade at this point? (final 4 beginning tomorrow)
I see that at Pinnacle the lines on VCU to win the championship are: Yes +604 No -750 Let’s figure out how much you would have to bet against VCU winning to lock in an equal win either way, and what that win would be. Let x bet the bet. Win outcome = 50,000 - x
Lose outcome = x*(100/750) = (2/15)x Set these equal to each other 50000-x = (2/15)x 50000 = (17/15)x x = 50000×(15/17) x = $44,117.65 Let see if that is right... If VCU wins the out come $50,000 minus from the Hilton minus $44,117.65 to Pinnacle = $5,882.35 If VCU doesn’t win you don’t get anything from the Hilton, but the Pinnacle bet will pay $44,117.65 × (100/750) = $5,882.35. However, the bet against VCU I doubt pays fair odds. If the owner was extremely risk averse, and was eager to sell the ticket, then I think about $6,000 would be a fair. However, I would base the probability of VCU winning on the +604 line that they will win, implying a 100/704 = 14.2% chance. That would make the value of the ticket about $7,100. This all ignores the tax implications. This question was raised and discussed in the forum of my companion site Wizard of Vegas.
Golf Digest claims that if four amateur golfers play a round that the probability that two get a hole-in-one on the same hole are 1 in 26,000,000. Do you agree with that figure?
No, I don't.
I will have to take on faith their statistic that for an amateur golfer, the probability of a hole-in-one are 1 in 12,500 per hole.
However, almost all hole-in-ones are achieved on par-3 holes. The typical course will have four such holes. So, the probability of a hole-in-one on a par 3 hole is (1/12500) × (4/18) = 1 in 2,778.
That said, the probability that exactly two golfers out of four get a hole-in-one on a par 3 hole is combin(4,2) × (1/12500)2 × (12449/12500)2 = 1 in 1,286,935.
Assuming four par-3 holes in a round, the probability of two hole-in-ones in the same hole are 4 × (1/1,286,935) = 1 in 321,734.
Where Golf Digest seems to have gone wrong is in assuming every hole has the same probability of a hole in one.
This question is raised and discussed in my forum at Wizard of Vegas.
The 2019 World Series went seven games with the visiting team winning every game. What are the odds of that? I had a friend that used to Martingale the world series on every home team until he won $100. How much would he have lost doing this?
The following table shows the Vegas Insider money lines on both teams for each game. The column for the fair money line on the road time splits the juice in half between the two teams. The probability column shows the probability of the road team visiting, based on that fair line.
2019 World Series Money Lines
| Date | Visiting Team |
Home Team |
Road Money Line |
Home Money Line |
Fair Money Line Road Team |
Prob. Win Road Team |
|---|---|---|---|---|---|---|
| 10/22/2019 | Wash | Hou | 180 | -200 | 190 | 34.48% |
| 10/23/2019 | Wash | Hou | 160 | -175 | 167.5 | 37.38% |
| 10/25/2019 | Hou | Wash | -150 | 140 | -145 | 59.18% |
| 10/26/2019 | Hou | Wash | -105 | -105 | 100 | 50.00% |
| 10/27/2019 | Hou | Wash | -230 | 200 | -215 | 68.25% |
| 10/29/2019 | Wash | Hou | 155 | -170 | 162.5 | 38.10% |
| 10/30/2019 | Wash | Hou | 130 | -140 | 135 | 42.55% |
Taking the product of the road team probability of winning in every game, we get 0.00422, which rounds to 1 in 237.
A home team Martingale to win $100 would have resulted in a loss of $28,081.06.
This question is asked and discussed in my forum at Wizard of Vegas.
A casino here in Las Vegas has a proposition bet on the first team to score a touchdown among all the games that start at 10:00, week 6 of the 2019 season. They go by game clock, not actual time. In the event of a tie, they go by the longest touchdown. The following table shows what each team pays on a "to one" basis. How would you analyze this?
Team to Score First Touchdown Odds
| Team | Pays |
|---|---|
| Bengals | 20 |
| Ravens | 6 |
| Seahawks | 11 |
| Browns | 10 |
| Texans | 8 |
| Chiefs | 5 |
| Saints | 10 |
| Jags | 10 |
| Eagles | 11 |
| Vikings | 8 |
| Redskins | 12 |
| Dolphins | 12 |
To analyze such a bet, I would first estimate the number of points each team will score. I do this using simple algebra with the point spread and the over/under. For example, consider the first game between the Bengals and Ravens. The Ravens are favored by 12 and the over/under is 48. Let:
b = points scored by Bengals
r = points scored by Ravens
b+12=r
b+r=48
To rearrange the first equation: b-4=-12. Then add that equation to b+r=48 and you get 2b=36, so b=18. If the Bengals are expected to score 18 points, then the Ravens are expected to score 18+12=30.
Once we have estimated total points we can get to estimated touchdowns. I do this by subtracting six field goal points from each team and then dividing the rest by 7.
The total number of touchdowns expected to be scored among these teams is 29.57. Next, divide estimated touchdowns for each team by that total. That will give an estimated probability that team will score the first touchdown. Then determine the expected value given that probability and what the bet pays.
As you can see in the table, I perceive a positive expected value on two teams only. The Redskins (yes, I call them that) at a 0.48% advantage and the Bengals at a 21.7% advantage. The edge on the Redskins is too small, but I would definitely bet the Bengals.
Team to Score First Touchdown Analysis
| Team | Pays | Spread | Over/ Under |
Expected Points |
Expected Touchdowns |
Prob. First Touchdown |
Fair Line |
Expected Value |
|---|---|---|---|---|---|---|---|---|
| Bengals | 20 | 12 | 48 | 18 | 1.71 | 5.80% | 16.25 | 21.74% |
| Ravens | 6 | -12 | 48 | 30 | 3.43 | 11.59% | 7.63 | -18.84% |
| Seahawks | 11 | 2 | 47.5 | 22.75 | 2.39 | 8.09% | 11.36 | -2.90% |
| Browns | 10 | -2 | 47.5 | 24.75 | 2.68 | 9.06% | 10.04 | -0.36% |
| Texans | 8 | 5.5 | 55.5 | 25 | 2.71 | 9.18% | 9.89 | -17.39% |
| Chiefs | 5 | -5.5 | 55.5 | 30.5 | 3.50 | 11.84% | 7.45 | -28.99% |
| Saints | 10 | -1 | 44 | 22.5 | 2.36 | 7.97% | 11.55 | -12.32% |
| Jags | 10 | 1 | 44 | 21.5 | 2.21 | 7.49% | 12.35 | -17.63% |
| Eagles | 11 | 3 | 43.5 | 20.25 | 2.04 | 6.88% | 13.53 | -17.39% |
| Vikings | 8 | -3 | 43.5 | 23.25 | 2.46 | 8.33% | 11.00 | -25.00% |
| Redskins | 12 | -3.5 | 40.5 | 22 | 2.29 | 7.73% | 11.94 | 0.48% |
| Dolphins | 12 | 3.5 | 40.5 | 18.5 | 1.79 | 6.04% | 15.56 | -21.50% |
P.S. The Bengals DID score the first touchdown that day!
This question is asked and discussed in my forum at Wizard of Vegas.
Is this parlay card any good?
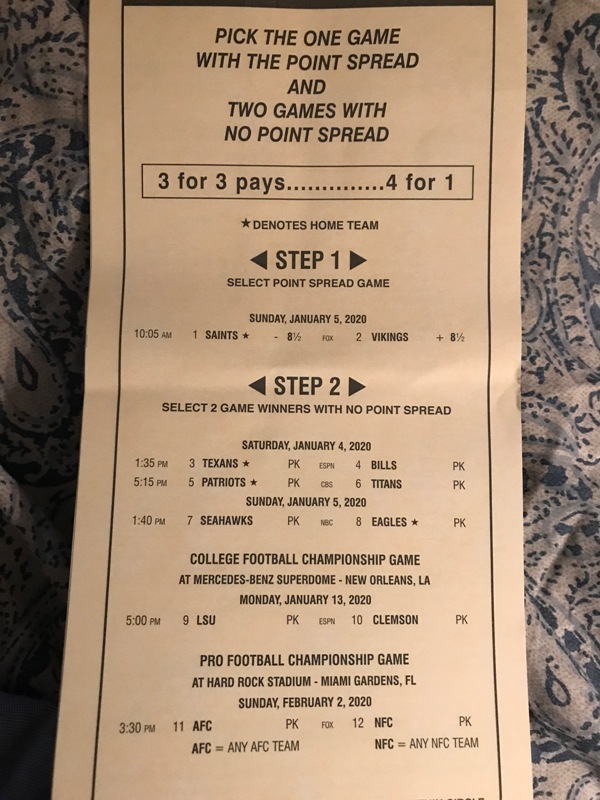
In step one, you have to bet either way against the spread in an NFL game. At the time you asked this question (Jan. 2, 2020), the Vikings were a 7.5-point underdog. According to my NFL alternate point spread calculator, the probability of the the Vikings +8.5 winning that side is 52.22%.
For all the other games, I looked at the going money lines, subtracted out the juice, to get at a probability of winning. That said, the following table shows the probability of each leg winning.
William Hill Parlay Card
| Leg | Fair Wine | Prob. Win |
|---|---|---|
| Saints -8.5 | -7.5 | 47.78% |
| Vikings +8.5 | 8.5 | 52.22% |
| Hou | -135 | 57.45% |
| Bills | 135 | 42.55% |
| Patriots | -205 | 67.21% |
| Titans | 205 | 32.79% |
| Sea | -118 | 54.13% |
| Phil | 118 | 45.87% |
| LSU | -200 | 66.67% |
| Clemson | 200 | 33.33% |
| AFC | -130 | 56.52% |
| NFC | 130 | 43.48% |
The two picks with the best chance of winning in step 1 are the Patriots and LSU. Here is the probability of my recommded picks winning:
- Vikings +8.5 — 52.22%
- Patriots — 67.21%
- LSU — 66.67%
The product of these probabilities is 23.40%. Getting 4 for 1 results in a return of 4 × 23.40% = 93.60%. In other words, the house edge is 6.40%. So, I'd leave this one alone.
I am showing a profit after 6,000 sports bets against spread, laying 11 to win 10. What are the odds of achieving that, assuming a 50% chance of winning each bet?
You can expect to be down 6000/22 = 272.73 bets.
The standard deviation of 6000 bets is sqrt(6000)*0.954545 = 73.93877.
Thus, you are 272.73/73.94 = 3.688556 standard deviations above expectations. Using the Gaussian curve, the probability of being up this many standard deviations or more is apx. 0.000112765 = apx. 1 in 8868.
I saw a Super Bowl 55 bet on whether the game would end in a unique NFL combination of scores that had never happened before in NFL history, called a Scorigami. The lines were:
Yes: +1100
No: -1400
What do you make the odds?
Good question! Fortunately, there is NFL Scorigami that tells us the count of every score combination in NFL history.
I'm sure the frequentists out there will hate my answer, but I had to make some assumptions to get a probability of an event that has never happened.
First, to get an individual team score, I looked at historical NFL games. In particular, the games between 1994 and 2018. The reason I chose 1994 is that is the year the two-point conversion rule started, which should result in smoothing out the individual team score distribution a little. I ended in 2018 because that was the upper end of the data I had available. Here is that distribution.
Individual NFL Team Scores 1994-2018
| Points | Count | Probability |
|---|---|---|
| 0 | 170 | 0.013490 |
| 1 | 0 | 0.000000 |
| 2 | 2 | 0.000159 |
| 3 | 303 | 0.024044 |
| 4 | 0 | 0.000000 |
| 5 | 5 | 0.000397 |
| 6 | 267 | 0.021187 |
| 7 | 420 | 0.033328 |
| 8 | 29 | 0.002301 |
| 9 | 188 | 0.014918 |
| 10 | 706 | 0.056023 |
| 11 | 32 | 0.002539 |
| 12 | 123 | 0.009760 |
| 13 | 646 | 0.051262 |
| 14 | 530 | 0.042057 |
| 15 | 128 | 0.010157 |
| 16 | 434 | 0.034439 |
| 17 | 892 | 0.070782 |
| 18 | 91 | 0.007221 |
| 19 | 282 | 0.022377 |
| 20 | 860 | 0.068243 |
| 21 | 511 | 0.040549 |
| 22 | 189 | 0.014998 |
| 23 | 548 | 0.043485 |
| 24 | 821 | 0.065148 |
| 25 | 118 | 0.009364 |
| 26 | 267 | 0.021187 |
| 27 | 673 | 0.053404 |
| 28 | 382 | 0.030313 |
| 29 | 131 | 0.010395 |
| 30 | 336 | 0.026662 |
| 31 | 578 | 0.045866 |
| 32 | 61 | 0.004841 |
| 33 | 146 | 0.011585 |
| 34 | 394 | 0.031265 |
| 35 | 200 | 0.015870 |
| 36 | 71 | 0.005634 |
| 37 | 163 | 0.012934 |
| 38 | 265 | 0.021028 |
| 39 | 30 | 0.002381 |
| 40 | 50 | 0.003968 |
| 41 | 146 | 0.011585 |
| 42 | 78 | 0.006189 |
| 43 | 25 | 0.001984 |
| 44 | 58 | 0.004602 |
| 45 | 85 | 0.006745 |
| 46 | 7 | 0.000555 |
| 47 | 16 | 0.001270 |
| 48 | 47 | 0.003730 |
| 49 | 35 | 0.002777 |
| 50 | 5 | 0.000397 |
| 51 | 15 | 0.001190 |
| 52 | 14 | 0.001111 |
| 53 | 1 | 0.000079 |
| 54 | 4 | 0.000317 |
| 55 | 6 | 0.000476 |
| 56 | 6 | 0.000476 |
| 57 | 2 | 0.000159 |
| 58 | 3 | 0.000238 |
| 59 | 5 | 0.000397 |
| 60 | 0 | 0.000000 |
| 61 | 0 | 0.000000 |
| 62 | 2 | 0.000159 |
| Total | 12602 | 1.000000 |
Not that it matters, but the mean team score is 21.60165.
Second, for every score x-y, that has never occured, I calculated the probability as 2×prob(x)×prob(y). Why multiply by two? Because a score of x-y can happen two ways. For example, Super Bowl 55 could end in a result of Kansas City x -- Tampa Bay y, or Kansas City y -- Tampa Bay x. A Super Bowl may not end in a tie, so we don't need to concern ourselves with x-x scores. If we did, we wouldn't multiply by 2.
For example, a score of 11-15 has never happened. I put the probability of an 11 at 0.002539 and 15 at 0.010157. This would make the probability of an 11-15 score 2×0.002539×0.010157 = 0.0000515835.
Doing this for every score that has never happened results in a total probability of 0.0179251. The fair line for a bet on that would be +5479, or about 55 to 1. So to lay only 11 to 1 is a great bet! I wish I had access to it.
I admit this assigns a zero to the possibility of either team getting one point, which has never happened, but could. Yes, there is such a thing as a one-point safety. The probability of either team getting a score of one I feel is extremely negligible.
In all reality, the over/under in Super Bowl 55 was 56.5. Such a high scoring game would increase the probability of a Scorigami. If forced to make an estimate, I'd put it at 2%, for a fair line of 49 to 1.
This question is asked and discussed in my forum at Wizard of Vegas.
BetMGM sometimes offers what they call a "Risk Free Bet," although it's not risk free. I think a better term would be a "second chance" bet. Here are the rules.
- The player makes a bet, subject to a maximum amount, on any event (no parlays, teasers, etc.)
- If the bet wins, it wins and the player is paid normally.
- If the bet loses, the player is given a promotional bet equal to the amount he lost.
- The promotional bet may also bet bet on any one event.
- If the promotional bet wins, the player is paid the winnings. If the promotional bet loses, then the player gets nothing. Either way, the promotional bet is taken away.
Here are my questions:
- What would be the value of a $100 Risk Free Bet if played against the spread at -110 odds?
- What strategy do you recommend?
First, let's look at betting against the spread at -110 odds. Let's assume a 50% chance of winning each bet.
- There is a 50% chance you win the original bet and profit $90.91.
- There is a 25% chance you lose the original bet and win the second one. Here you will have lost $100 and won $90.91, for a net win of -$9.09.
- There is a 25% chance you lose both bets for a loss of $100.
The expected value of this promotional bet is 0.5×$90.91 + 0.25×-9.09 + 0.25×-100 = $18.18.
Second, what do I recommend? I suggest betting on the biggest longshot you can find. At the time you asked this question, the biggest longshot I could find was this college football game:
Miami (FL) +575
Alabama -1000
Assuming the house edge is the same on both bets, the probability of Miami winning is 14.01%. This would result in a house edge of 5.41% both ways.
Let's assume if the player loses he will find another game at the same odds to use his second chance on. That said, here are the possible outcomes:
- There is a 14.01% chance you win the original bet and profit $575.00.
- There is a 12.05% chance you lose the original bet and win the second one. Here you will have lost $100 and won $575, for a net win of $475.
- There is a 25% chance you lose both bets for a loss of $100.
The expected value of this promotional bet is 0.1401×$575 + 0.1205×$475 + 0.7394×-$100 = $63.87.
Bottom line is to throw a Hail Mary both times. This advice is true of "use once" promotional chips in general. Unfortunately, such chips are usually restricted to even money bets.
This question is asked and discussed in my forum at Wizard of Vegas.
In the National Hockey League, in a regular season game, if a game ends in the regulation time, two points are awarded to the winner and zero to the loser. However, if the game goes into overtime, then the winner still gets two points, but the loser will get one point. Meanwhile, there is no such incentive to get to overtime in the playoffs.
Do you think that if the game is tied late in the game, during the regular season, both teams will kill the clock to try to get to overtime? It would seem logical to do so, because there will be three points awarded between the two teams, instead of two.
There does indeed seem to be an incentive to get to overtime in Hockey, for the reason you state. Let's look at some data to answer your question. The following data is from four hockey seasons, starting with the 2017/2018 season.
The following table breaks down the 7,846 games played over the four seasons between whether it was a regular seaon or playoff game and whether it went into overtime. The table shows that during the regular season, 11.27% of games went into overtime, while during the playoffs 54/544 = 9.03% did.
NHL Overtime Data
| Season | Overtime | Games |
|---|---|---|
| Regular | Yes | 817 |
| Regular | No | 6431 |
| Playoffs | Yes | 54 |
| Playoffs | No | 544 |
The question is whether this difference between 11.27% and 9.03% is statistically significant or perhaps explained by normal variance. To test two sample means, I'm going to do a chi-squared test, like the Comparison of proportions calculator at MedCalc.org. Over all 7,846 games, 871 went into overtime for a probability of 11.10%. The probability of no overtime is 88.90% over the same sample. If we assume there is no statistically significant difference between regular season and playoff games, then 804.6 regular season games should have gone into overtime and 66.4 playoff games.
The following table compares the actual results against expectations, under the assumption that the true probability of overtime is the same for both regular seasons and playoff games. The right column shows the chi-squared statistic, which is the square of the difference between the actual and expected totals, divided by the expected total.
NHL Overtime Data — Chi-Squared Test
| Season | Overtime | Actual Total |
Expected Total |
X^2 |
|---|---|---|---|---|
| Regular | Yes | 817 | 804.61 | 0.190641 |
| Regular | No | 6431 | 6443.39 | 0.023806 |
| Playoffs | Yes | 54 | 66.39 | 2.310641 |
| Playoffs | No | 544 | 531.61 | 0.288540 |
| Total | 7846 | 7846.00 | 2.813628 |
The table above shows a chi-squared statistic of 2.813628. With one degree of freedom, the probability of results this skewed or more is 9.347%. In other words, if there were no change in behavior between a regular season and play off game, resulting in a truly equal probability of overtime, the probability we would see such a 2.24% disparity in games going into overtime, or more, is 9.347%. To put it in simple English, this evidence does point towards a statistically significant difference between overtime rates between the two types of games. However, there is still a 9.35% chance that it can be explained as normal random variance.
I should add that the MedCalc calculator I linked to, as well as other sources, apply an "N-1" adjustment to the chi-squared statistic. To be specific, they multiply the chi-squared statistic by (N-1)/N, where N is the total number of observations. This this case, the adjusted chi-squuared statistic would be 2.813628 * (7845/7846) = 2.813270. The p value for this chi-squared statistic with one degree of freedom is 9.349%. I hate to muddy the waters with this minor adjustment, but if I didn't, I'm sure my readers would wonder why I didn't.
Personally, I believe teams do play to get to overtime moreso in the regular season than the playoffs and the data helps support this, but the data doesn't make the case beyond a reasonable doubt.
External Links
- Use of the Chi-Square Statistic at Johns Hopkins Bloomberg School of Public Heath.
What were the average number of touchdowns, field goals and safeties per game in the 2021 regular season? What was the success rate for field goals, extra points, and two-point conversions?
Here are the averages of each type of score as well as total points per game.
- Touchdowns: 5.23
- Field goals: 3.78
- Safties: 0.03
- Average points: 45.96
Here is a breakdown of what happened after each touchdown.
- Extra point attempt successful: 82.5%
- Extra point attempt unsuccessful: 5.8%
- Two-point conversion attempt successful: 5.3%
- Two-point conversion attempt unsuccessful: 6.4%
Here are some success rates for field goals, extra points, and two-point conversions.
- Field goal attempt successful: 85.1%
- Extra point attempt successful: 93.4%
- Two-point conversion attempt successful: 45.2%