- Home ›
- Online Sports Betting ›
- NFL Average Scores per Game 2000-2020
On this page
NFL Average Scores per Game 2000-2020
Introduction
This article is a simple look at the average number of each way to score in the NFL has changed in the 20-year period ending in 2020. I look at regular season games only.
Touchdowns
The following graph shows the average touchdowns per game by year. The blue line shows the average per game per year. The red line shows the least-squares regression line, which flattens out the ups and downs to show the overall trend.
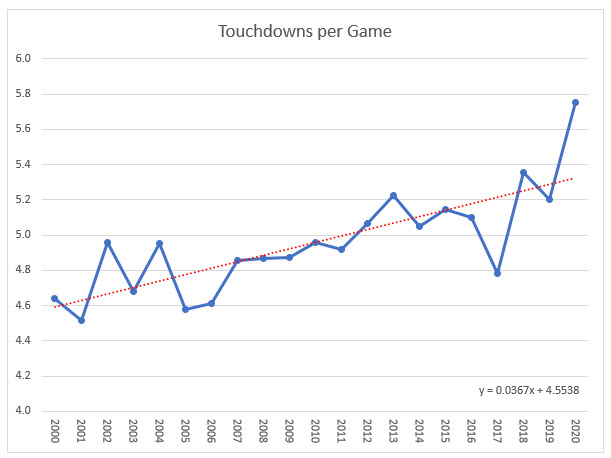
It's easy to see there the trend of increasing touchdowns. The red trend line shows an increase of 0.0367 touchdowns per game per year. Over 21 years covered, that is an increase of 0.77 per game.
Extra Points
The following graph shows the average extra points after a touchdown per game by year. The blue line shows the average per year. The red line shows the least-squares regression line, which flattens out the ups and downs to show the overall trend.
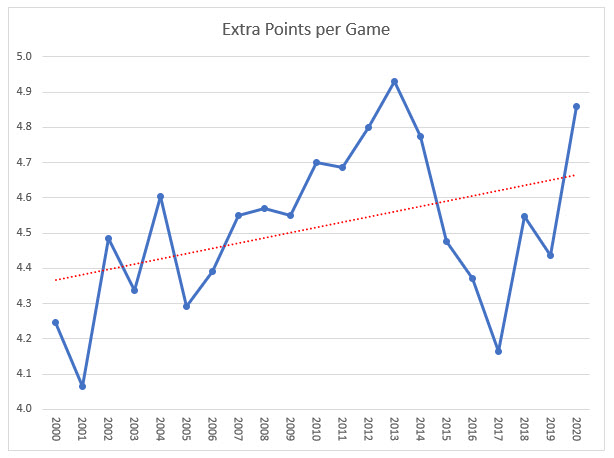
Although there is an increasing trend in more extra points per game by year, it isn't as strong as the increasing touchdowns. This is obviously due to two-point conversion attempts becoming more popular. The red trend line shows an increase of 0.015 touchdowns per game per year. Over 21 years covered, that is an increase of 0.315 per game.
Two-Point Conversions
The following graph shows the average two-point conversions after a touchdown per game. The blue line shows the average per year. The red line shows the least-squares regression line, which flattens out the ups and downs to show the overall trend.
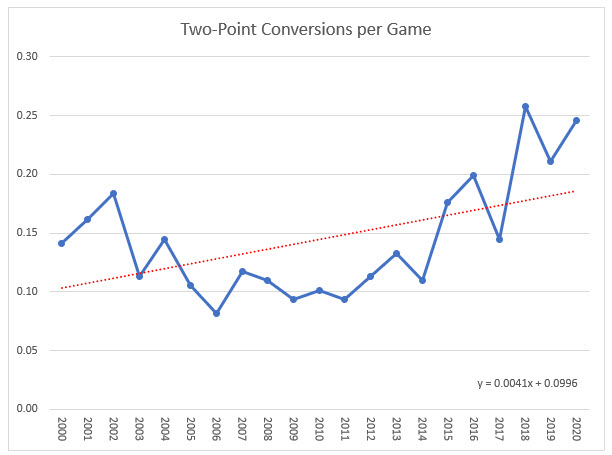
The red trend line shows an increase of 0.0041 two-point conversions per game by year. Over 21 years covered, that is an increase of 0.086 per game per year. This may not sound like much, but the average two-point conversions per game over the 21-year period is 0.294. The 0.086 increase per game represents 29% of the overall average per game.
Field Goals
The following graph shows the average field goals per game. The blue line shows the average per year. The red line shows the least-squares regression line, which flattens out the ups and downs to show the overall trend.
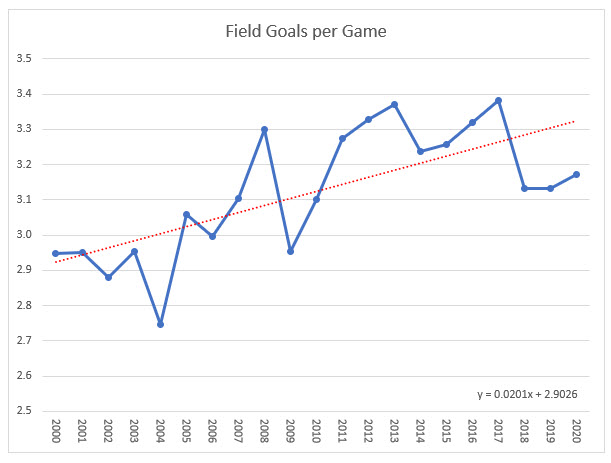
The red trend line shows increase of 0.0201 field goals per game per year. Over the 21-year period, that is an increase of 0.4221 per game. The average over the 21 period is 3.12, so an increase of 0.42 per game represents a significant change.
Safties
The following graph shows the average safties per game by year. The blue line shows the average per year. The red line shows the least-squares regression line, which flattens out the ups and downs to show the overall trend.
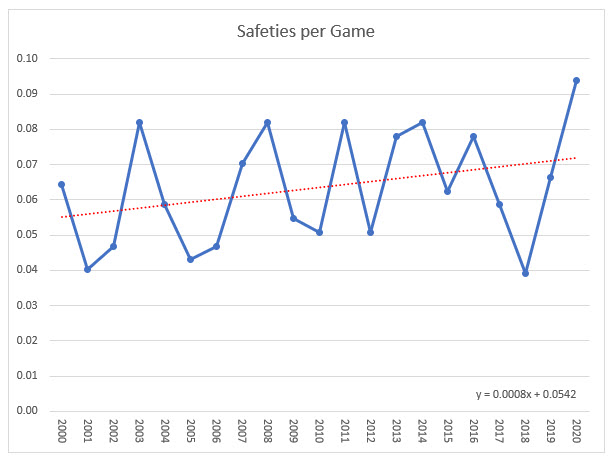
The red trend line shows a very minor increase of 0.0008 safties per game per year by year. Over the 21-year period, that is an increase of 0.0168 per game. The average over the 21 period is 0.0634, so an increase of 0.0168 per game represents a moderate increase.
Total Points Scored
The following graph shows the average points scored per game by year. The blue line shows the average per year. The red line shows the least-squares regression line, which flattens out the ups and downs to show the overall trend.
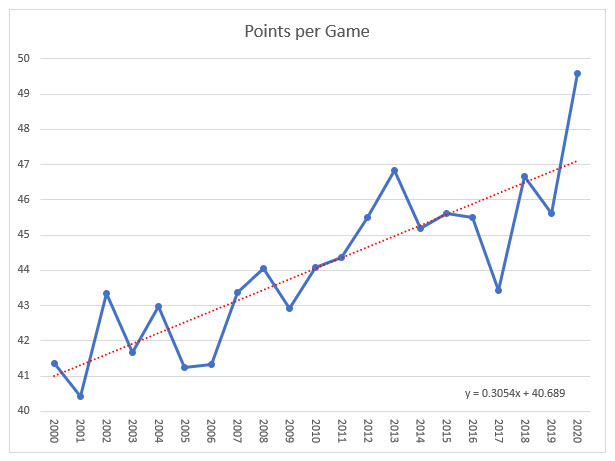
The red trend line shows a very minor increase of 0.3054 points scored per game per year by year . Over the 21-year period, that is an increase of 6.41 per year. The average over the 21 period is 44.36, so an increase of 6.41 per year represents a significant increase.
Raw Data
The following table shows the year by year totals from 1935 to 2020. The source of the data is Pro Football Reference.
1935-2020 Raw Data
| Year | Games | Touchdowns | Extra Points | 2-Pt Conv. | Field Goals | Safties | Total Pts. |
|---|---|---|---|---|---|---|---|
| 2020 | 512 | 2,946 | 2,488 | 126 | 1,624 | 48 | 25,384 |
| 2019 | 512 | 2,664 | 2,272 | 108 | 1,604 | 34 | 23,352 |
| 2018 | 512 | 2,742 | 2,328 | 132 | 1,604 | 20 | 23,896 |
| 2017 | 512 | 2,450 | 2,132 | 74 | 1,732 | 30 | 22,236 |
| 2016 | 512 | 2,612 | 2,238 | 102 | 1,700 | 40 | 23,294 |
| 2015 | 512 | 2,636 | 2,292 | 90 | 1,668 | 32 | 23,356 |
| 2014 | 512 | 2,586 | 2,444 | 56 | 1,658 | 42 | 23,130 |
| 2013 | 512 | 2,676 | 2,524 | 68 | 1,726 | 40 | 23,974 |
| 2012 | 512 | 2,594 | 2,458 | 58 | 1,704 | 26 | 23,302 |
| 2011 | 512 | 2,518 | 2,400 | 48 | 1,676 | 42 | 22,716 |
| 2010 | 512 | 2,540 | 2,406 | 52 | 1,588 | 26 | 22,566 |
| 2009 | 512 | 2,494 | 2,330 | 48 | 1,512 | 28 | 21,982 |
| 2008 | 512 | 2,492 | 2,340 | 56 | 1,690 | 42 | 22,558 |
| 2007 | 512 | 2,486 | 2,330 | 60 | 1,590 | 36 | 22,208 |
| 2006 | 512 | 2,362 | 2,248 | 42 | 1,534 | 24 | 21,154 |
| 2005 | 512 | 2,344 | 2,198 | 54 | 1,566 | 22 | 21,112 |
| 2004 | 512 | 2,536 | 2,358 | 74 | 1,406 | 30 | 22,000 |
| 2003 | 512 | 2,396 | 2,220 | 58 | 1,512 | 42 | 21,332 |
| 2002 | 512 | 2,540 | 2,296 | 94 | 1,474 | 24 | 22,194 |
| 2001 | 496 | 2,240 | 2,016 | 80 | 1,464 | 20 | 20,048 |
| 2000 | 496 | 2,302 | 2,106 | 70 | 1,462 | 32 | 20,508 |
| 1999 | 496 | 2,306 | 2,102 | 62 | 1,498 | 46 | 20,648 |
| 1998 | 480 | 2,314 | 2,062 | 82 | 1,416 | 36 | 20,430 |
| 1997 | 480 | 2,240 | 1,986 | 94 | 1,416 | 26 | 19,914 |
| 1996 | 480 | 2,168 | 1,954 | 88 | 1,464 | 40 | 19,610 |
| 1995 | 480 | 2,322 | 2,060 | 80 | 1,476 | 24 | 20,628 |
| 1994 | 448 | 2,040 | 1,782 | 118 | 1,280 | 26 | 18,150 |
| 1993 | 448 | 1,812 | 1,752 | - | 1,346 | 46 | 16,754 |
| 1992 | 448 | 1,916 | 1,872 | - | 1,122 | 24 | 16,782 |
| 1991 | 448 | 1,898 | 1,838 | - | 1,246 | 24 | 17,012 |
| 1990 | 448 | 2,070 | 1,994 | - | 1,180 | 38 | 18,030 |
| 1989 | 448 | 2,120 | 2,050 | - | 1,202 | 44 | 18,464 |
| 1988 | 448 | 2,102 | 2,008 | - | 1,142 | 52 | 18,150 |
| 1987 | 420 | 2,124 | 2,020 | - | 1,102 | 36 | 18,142 |
| 1986 | 448 | 2,154 | 2,052 | - | 1,118 | 28 | 18,386 |
| 1985 | 448 | 2,250 | 2,146 | - | 1,192 | 34 | 19,290 |
| 1984 | 448 | 2,236 | 2,150 | - | 1,126 | 30 | 19,004 |
| 1983 | 448 | 2,328 | 2,208 | - | 1,102 | 38 | 19,558 |
| 1982 | 252 | 1,190 | 1,114 | - | 622 | 20 | 10,160 |
| 1981 | 448 | 2,208 | 2,082 | - | 1,042 | 34 | 18,524 |
| 1980 | 448 | 2,224 | 2,084 | - | 956 | 30 | 18,356 |
| 1979 | 448 | 2,202 | 1,982 | - | 908 | 30 | 17,978 |
| 1978 | 448 | 1,994 | 1,828 | - | 854 | 36 | 16,426 |
| 1977 | 392 | 1,630 | 1,482 | - | 720 | 22 | 13,466 |
| 1976 | 392 | 1,820 | 1,632 | - | 800 | 32 | 15,016 |
| 1975 | 364 | 1,840 | 1,668 | - | 738 | 34 | 14,990 |
| 1974 | 364 | 1,620 | 1,466 | - | 670 | 20 | 13,236 |
| 1973 | 364 | 1,560 | 1,508 | - | 1,086 | 24 | 14,174 |
| 1972 | 364 | 1,680 | 1,622 | - | 998 | 24 | 14,744 |
| 1971 | 364 | 1,612 | 1,572 | - | 936 | 22 | 14,096 |
| 1970 | 364 | 1,594 | 1,544 | - | 956 | 22 | 14,020 |
| 1969 | 224 | 1,128 | 1,102 | - | 486 | 18 | 9,364 |
| 1968 | 224 | 1,110 | 1,056 | - | 484 | 8 | 9,184 |
| 1967 | 224 | 1,212 | 1,174 | - | 438 | 14 | 9,788 |
| 1966 | 210 | 1,082 | 1,042 | - | 526 | 6 | 9,124 |
| 1965 | 196 | 1,126 | 1,076 | - | 392 | 16 | 9,040 |
| 1964 | 196 | 1,056 | 1,002 | - | 428 | 8 | 8,638 |
| 1963 | 196 | 1,074 | 1,020 | - | 376 | 12 | 8,616 |
| 1962 | 196 | 1,096 | 1,046 | - | 360 | 22 | 8,746 |
| 1961 | 196 | 1,052 | 1,020 | - | 358 | 12 | 8,430 |
| 1960 | 156 | 820 | 784 | - | 326 | 22 | 6,726 |
| 1959 | 144 | 780 | 744 | - | 232 | 12 | 6,144 |
| 1958 | 144 | 832 | 788 | - | 238 | 6 | 6,506 |
| 1957 | 144 | 708 | 676 | - | 256 | 10 | 5,712 |
| 1956 | 144 | 746 | 700 | - | 226 | 8 | 5,870 |
| 1955 | 144 | 764 | 712 | - | 230 | 8 | 6,002 |
| 1954 | 144 | 800 | 762 | - | 238 | 14 | 6,304 |
| 1953 | 144 | 794 | 754 | - | 216 | 14 | 6,194 |
| 1952 | 144 | 838 | 774 | - | 190 | 22 | 6,416 |
| 1951 | 144 | 822 | 778 | - | 196 | 10 | 6,318 |
| 1950 | 156 | 958 | 894 | - | 160 | 18 | 7,158 |
| 1949 | 120 | 730 | 678 | - | 124 | 8 | 5,446 |
| 1948 | 120 | 778 | 712 | - | 90 | 6 | 5,662 |
| 1947 | 120 | 712 | 658 | - | 106 | 10 | 5,268 |
| 1946 | 110 | 582 | 516 | - | 94 | 12 | 4,314 |
| 1945 | 100 | 518 | 458 | - | 68 | 6 | 3,782 |
| 1944 | 110 | 514 | 440 | - | 46 | 6 | 3,674 |
| 1943 | 100 | 446 | 400 | - | 32 | - | 3,172 |
| 1942 | 110 | 486 | 436 | - | 66 | 6 | 3,562 |
| 1941 | 110 | 490 | 418 | - | 94 | 4 | 3,648 |
| 1940 | 110 | 448 | 378 | - | 84 | 10 | 3,338 |
| 1939 | 110 | 448 | 368 | - | 104 | 8 | 3,384 |
| 1938 | 110 | 394 | 326 | - | 82 | 10 | 2,956 |
| 1937 | 110 | 374 | 308 | - | 92 | 10 | 2,848 |
| 1936 | 108 | 332 | 272 | - | 96 | 8 | 2,568 |
| 1935 | 108 | 302 | 234 | - | 86 | 6 | 2,316 |
Averages by Year
The following table shows the average scores and total points by year from 1935 to 2020, based on the totals in the table above.
1935-2020 Averages
| Year | Touchdowns | Extra Points | 2-Pt Conv. | Field Goals | Safties | Total Pts. |
|---|---|---|---|---|---|---|
| 2020 | 5.75 | 4.86 | 0.25 | 3.17 | 0.09 | 49.58 |
| 2019 | 5.20 | 4.44 | 0.21 | 3.13 | 0.07 | 45.61 |
| 2018 | 5.36 | 4.55 | 0.26 | 3.13 | 0.04 | 46.67 |
| 2017 | 4.79 | 4.16 | 0.14 | 3.38 | 0.06 | 43.43 |
| 2016 | 5.10 | 4.37 | 0.20 | 3.32 | 0.08 | 45.50 |
| 2015 | 5.15 | 4.48 | 0.18 | 3.26 | 0.06 | 45.62 |
| 2014 | 5.05 | 4.77 | 0.11 | 3.24 | 0.08 | 45.18 |
| 2013 | 5.23 | 4.93 | 0.13 | 3.37 | 0.08 | 46.82 |
| 2012 | 5.07 | 4.80 | 0.11 | 3.33 | 0.05 | 45.51 |
| 2011 | 4.92 | 4.69 | 0.09 | 3.27 | 0.08 | 44.37 |
| 2010 | 4.96 | 4.70 | 0.10 | 3.10 | 0.05 | 44.07 |
| 2009 | 4.87 | 4.55 | 0.09 | 2.95 | 0.05 | 42.93 |
| 2008 | 4.87 | 4.57 | 0.11 | 3.30 | 0.08 | 44.06 |
| 2007 | 4.86 | 4.55 | 0.12 | 3.11 | 0.07 | 43.38 |
| 2006 | 4.61 | 4.39 | 0.08 | 3.00 | 0.05 | 41.32 |
| 2005 | 4.58 | 4.29 | 0.11 | 3.06 | 0.04 | 41.23 |
| 2004 | 4.95 | 4.61 | 0.14 | 2.75 | 0.06 | 42.97 |
| 2003 | 4.68 | 4.34 | 0.11 | 2.95 | 0.08 | 41.66 |
| 2002 | 4.96 | 4.48 | 0.18 | 2.88 | 0.05 | 43.35 |
| 2001 | 4.52 | 4.06 | 0.16 | 2.95 | 0.04 | 40.42 |
| 2000 | 4.64 | 4.25 | 0.14 | 2.95 | 0.06 | 41.35 |
| 1999 | 4.65 | 4.24 | 0.13 | 3.02 | 0.09 | 41.63 |
| 1998 | 4.82 | 4.30 | 0.17 | 2.95 | 0.08 | 42.56 |
| 1997 | 4.67 | 4.14 | 0.20 | 2.95 | 0.05 | 41.49 |
| 1996 | 4.52 | 4.07 | 0.18 | 3.05 | 0.08 | 40.85 |
| 1995 | 4.84 | 4.29 | 0.17 | 3.08 | 0.05 | 42.98 |
| 1994 | 4.55 | 3.98 | 0.26 | 2.86 | 0.06 | 40.51 |
| 1993 | 4.04 | 3.91 | - | 3.00 | 0.10 | 37.40 |
| 1992 | 4.28 | 4.18 | - | 2.50 | 0.05 | 37.46 |
| 1991 | 4.24 | 4.10 | - | 2.78 | 0.05 | 37.97 |
| 1990 | 4.62 | 4.45 | - | 2.63 | 0.08 | 40.25 |
| 1989 | 4.73 | 4.58 | - | 2.68 | 0.10 | 41.21 |
| 1988 | 4.69 | 4.48 | - | 2.55 | 0.12 | 40.51 |
| 1987 | 5.06 | 4.81 | - | 2.62 | 0.09 | 43.20 |
| 1986 | 4.81 | 4.58 | - | 2.50 | 0.06 | 41.04 |
| 1985 | 5.02 | 4.79 | - | 2.66 | 0.08 | 43.06 |
| 1984 | 4.99 | 4.80 | - | 2.51 | 0.07 | 42.42 |
| 1983 | 5.20 | 4.93 | - | 2.46 | 0.08 | 43.66 |
| 1982 | 4.72 | 4.42 | - | 2.47 | 0.08 | 40.32 |
| 1981 | 4.93 | 4.65 | - | 2.33 | 0.08 | 41.35 |
| 1980 | 4.96 | 4.65 | - | 2.13 | 0.07 | 40.97 |
| 1979 | 4.92 | 4.42 | - | 2.03 | 0.07 | 40.13 |
| 1978 | 4.45 | 4.08 | - | 1.91 | 0.08 | 36.67 |
| 1977 | 4.16 | 3.78 | - | 1.84 | 0.06 | 34.35 |
| 1976 | 4.64 | 4.16 | - | 2.04 | 0.08 | 38.31 |
| 1975 | 5.05 | 4.58 | - | 2.03 | 0.09 | 41.18 |
| 1974 | 4.45 | 4.03 | - | 1.84 | 0.05 | 36.36 |
| 1973 | 4.29 | 4.14 | - | 2.98 | 0.07 | 38.94 |
| 1972 | 4.62 | 4.46 | - | 2.74 | 0.07 | 40.51 |
| 1971 | 4.43 | 4.32 | - | 2.57 | 0.06 | 38.73 |
| 1970 | 4.38 | 4.24 | - | 2.63 | 0.06 | 38.52 |
| 1969 | 5.04 | 4.92 | - | 2.17 | 0.08 | 41.80 |
| 1968 | 4.96 | 4.71 | - | 2.16 | 0.04 | 41.00 |
| 1967 | 5.41 | 5.24 | - | 1.96 | 0.06 | 43.70 |
| 1966 | 5.15 | 4.96 | - | 2.50 | 0.03 | 43.45 |
| 1965 | 5.74 | 5.49 | - | 2.00 | 0.08 | 46.12 |
| 1964 | 5.39 | 5.11 | - | 2.18 | 0.04 | 44.07 |
| 1963 | 5.48 | 5.20 | - | 1.92 | 0.06 | 43.96 |
| 1962 | 5.59 | 5.34 | - | 1.84 | 0.11 | 44.62 |
| 1961 | 5.37 | 5.20 | - | 1.83 | 0.06 | 43.01 |
| 1960 | 5.26 | 5.03 | - | 2.09 | 0.14 | 43.12 |
| 1959 | 5.42 | 5.17 | - | 1.61 | 0.08 | 42.67 |
| 1958 | 5.78 | 5.47 | - | 1.65 | 0.04 | 45.18 |
| 1957 | 4.92 | 4.69 | - | 1.78 | 0.07 | 39.67 |
| 1956 | 5.18 | 4.86 | - | 1.57 | 0.06 | 40.76 |
| 1955 | 5.31 | 4.94 | - | 1.60 | 0.06 | 41.68 |
| 1954 | 5.56 | 5.29 | - | 1.65 | 0.10 | 43.78 |
| 1953 | 5.51 | 5.24 | - | 1.50 | 0.10 | 43.01 |
| 1952 | 5.82 | 5.38 | - | 1.32 | 0.15 | 44.56 |
| 1951 | 5.71 | 5.40 | - | 1.36 | 0.07 | 43.88 |
| 1950 | 6.14 | 5.73 | - | 1.03 | 0.12 | 45.88 |
| 1949 | 6.08 | 5.65 | - | 1.03 | 0.07 | 45.38 |
| 1948 | 6.48 | 5.93 | - | 0.75 | 0.05 | 47.18 |
| 1947 | 5.93 | 5.48 | - | 0.88 | 0.08 | 43.90 |
| 1946 | 5.29 | 4.69 | - | 0.85 | 0.11 | 39.22 |
| 1945 | 5.18 | 4.58 | - | 0.68 | 0.06 | 37.82 |
| 1944 | 4.67 | 4.00 | - | 0.42 | 0.05 | 33.40 |
| 1943 | 4.46 | 4.00 | - | 0.32 | - | 31.72 |
| 1942 | 4.42 | 3.96 | - | 0.60 | 0.05 | 32.38 |
| 1941 | 4.45 | 3.80 | - | 0.85 | 0.04 | 33.16 |
| 1940 | 4.07 | 3.44 | - | 0.76 | 0.09 | 30.35 |
| 1939 | 4.07 | 3.35 | - | 0.95 | 0.07 | 30.76 |
| 1938 | 3.58 | 2.96 | - | 0.75 | 0.09 | 26.87 |
| 1937 | 3.40 | 2.80 | - | 0.84 | 0.09 | 25.89 |
| 1936 | 3.07 | 2.52 | - | 0.89 | 0.07 | 23.78 |
| 1935 | 2.80 | 2.17 | - | 0.80 | 0.06 | 21.44 |
Summary
The following table shows the totals for each score over the 21 seasons from 2000 to 2020. The number of regular-season games played in that time was 10,720.
2000-2020 NFL Scoring Summary
| Score | Total | Average /Game |
Increase /Year |
|---|---|---|---|
| Touchdown | 53,156 | 4.9586 | 0.0367 |
| Extra point | 48,424 | 4.5172 | 0.0150 |
| Two-point conversion | 3,148 | 0.2937 | 0.0041 |
| Field goal | 33,494 | 3.1244 | 0.0201 |
| Safety | 680 | 0.0634 | 0.0008 |
| Total points | 475,498 | 44.3562 | 0.3054 |
External Links
- Pro Football Reference — Source of data
- 2020 finishes as highest-scoring season in NFL history — Article at NFL.com.
Compare Online NFL Odds
| Upcoming matches | Money Line | Spread | Total | Featured Insight |
|---|---|---|---|---|
|
Sun Dec 22nd 8pm
Dallas Cowboys Tampa Bay Buccaneers |
New customers only. T&C's apply. 18+.This offer is not available for players residing in Ontario. New Customer Offer. T&C’s Apply. 19+. Minimum deposit: $50. |
|
|
Cowboys' strong offense faces Buccaneers' solid defense. Key players and turnovers will likely decide the game's outcome. Watch for momentum shifts in crucial moments. |
|
Mon Dec 23rd 8pm
Green Bay Packers New Orleans Saints |
|
New Customer Offer. T&C’s Apply. 18+. For the first cryptocurrency deposit. Allowed: USA and Canada. Minimum deposit $20. |
|
Green Bay Packers may face challenges against New Orleans Saints due to strong Saints defense. Key players to watch: Aaron Rodgers and Alvin Kamara. Weather could impact play strategies. |
Written by: Michael Shackleford


