On this page
Bingo Probabilities: Analysis of the Jumbo progressive at Station Casinos
On this page
Update
Since I wrote my initial report the Station casinos have evidently changed the distribution of odds and evens again, probably sometime in October. The following table shows a recent distribution of cards taken by myself and another played I'll just call "L."
 Ohio Recommended Online Bingo Rooms
New Sampling of Jumbo Bingo Cards
| Number of Odds |
Mike's Sample | L's Sample | Total Sample | Probability |
|---|---|---|---|---|
| 9 | 2 | 3 | 5 | 0.011261 |
| 10 | 7 | 10 | 17 | 0.038288 |
| 11 | 14 | 25 | 39 | 0.087838 |
| 12 | 34 | 41 | 75 | 0.168919 |
| 13 | 41 | 71 | 112 | 0.252252 |
| 14 | 86 | 110 | 196 | 0.441441 |
| Total | 184 | 260 | 444 | 1 |
Although the range of 9 to 14 odds remains the same the probability is now heavily weighted towards 14 odds, as opposed to more even distribution previously. More odds makes it harder to win the progressive jackpot. Based on this sampling I now recommend waiting until the Jumbo Ball reach 54 if you want an positive expected value.
The next table compares my total sample with the expected totals given the same sample size and the probability of each total assuming the same method of drawing cards explained to me previously by Stephen L. Cavallaro (Executive Vice President & Chief Operating Officer of Station Casinos).
Actual Vs. Expected Totals
| Number of Odds |
Sample Total | Expected Total |
|---|---|---|
| 9 | 5 | 33.17 |
| 10 | 17 | 60.48 |
| 11 | 39 | 87.61 |
| 12 | 75 | 101.15 |
| 13 | 112 | 93.18 |
| 14 | 196 | 68.41 |
| Total | 444 | 444 |
It is plain to see that my results do not conform to what was expected. A statistical test on the skewness of this distribution compared to expectations results in a chi-squared statistic of 330.71 with 5 degrees of freedom. The probability of results this skewed or more are 1 in 402,433,741,048,496,000,000,000,000,000,000,000,000,000,000,000,000,000,000,000,000,000,000. To put this in perspective, the probability of hitting the Powerball eight times in a row are greater.
To further argue there has been a change in the way cards are drawn the following table shows the results of my sample before and after the alleged alteration. Sample 1 was taken in August, sample 2 was taken Oct 30 and Nov 1.
Old Vs. New Sample
| Number of Odds |
Sample 1 | Sample 2 | Sample 1 Probability | Sample 2 Probability |
|---|---|---|---|---|
| 9 | 35 | 5 | 13.51% | 1.13% |
| 10 | 35 | 17 | 13.51% | 3.83% |
| 11 | 34 | 39 | 13.13% | 8.78% |
| 12 | 48 | 75 | 18.53% | 16.89% |
| 13 | 55 | 112 | 21.24% | 25.23% |
| 14 | 52 | 196 | 20.08% | 44.14% |
| Total | 259 | 444 | 100% | 100% |
The following graph compares the two probability columns in the above table relative to the expected probabilites.
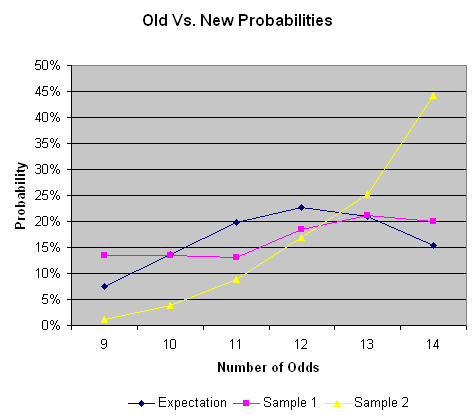
I put in an inquiry about how the new cards are drawn to Station Casinos management and was told there was no change in the way the cards are drawn. No comment was made about my evidence to the contrary and due to my "negative reporting" further cooperation was denied.
Notes: "Mike's sample" was collected at the 3:00 session, November 1, at the Sunset Station. "L's sample" was collected at the 9:00 a.m. and 11:00 a.m. sessions, October 30, at the Boulder Station.
Following is my initial study, which is now outdated.
Following is my evidence that the progressive bingo cards sold at the following Las Vegas casinos are not created entirely randomly.
- Palace Station
- Santa Fe Station
- Texas Station
- Boulder Station
- Sunset Station
- Fiesta Rancho
- Fiesta Henderson
- Sam's Town
The Station casinos in Las Vegas run a linked bingo progressive called Jumbo Bingo. The progressive meter starts at $100,000. To win the player must get a cover all (cover all 24 numbers on the card) within 47 calls. In the event nobody at any of the five bingo parlors hits it in the first week the number of calls to win the progressive (called the Jumbo Ball) moves up by one to 48. Likewise the Jumbo Ball will increase by one every week until somebody wins.
Evidently in an effort to save time the first 37 numbers called are all even numbers between 2 and 74. The Jumbo Bingo cards are conveniently premarked for all even numbers. When the game starts the caller will ask if anybody won based on a card with all even numbers. Then after nobody claims a winning card the caller will draw balls at random, disregarding the even numbered balls. If nobody gets a coverall by the time the Jumbo Ball is called there is a $5000 consolation prize for a coverall within 52 calls. If nobody claims that there is an $1199 prize for the first person to get a coverall regardless of the number of calls. As always in bingo any prize is split if multiple players win concurrently.
The Fiesta casinos have a very similar game on a smaller scale. The progresive starts at $25,000 and the consolation prizes are smaller. It is the same in that all the even numbers are called in advance. At Sam's Town the game is reversed with the odd numbers called in advance.
The following table displays the probability distribution according to the total odd numbers on the card for a fair card. My definition of a fair card is one in which the 5 "B" numbers are randomly chosen from 1 to 15, the 5 "I" number are randomly chosen between 16 and 30, and so on. Another way to achieve the same result would be to draw numbers from 1 to 75 filling up the card as numbers are chosen, and disregarding numbers if the corresponding column had already been filled.
Probability for Total Odd Numbers - Fair Card
| Number of Odds |
Probability | Inverse Probability |
|---|---|---|
| 0 | 0.000000000436 | 1 in 2293355030 |
| 1 | 0.000000022747 | 1 in 43962077 |
| 2 | 0.000000534794 | 1 in 1869877 |
| 3 | 0.000007530006 | 1 in 132802 |
| 4 | 0.000071202834 | 1 in 14044 |
| 5 | 0.000480801205 | 1 in 2080 |
| 6 | 0.002407676276 | 1 in 415 |
| 7 | 0.00916827051 | 1 in 109 |
| 8 | 0.027013789916 | 1 in 37 |
| 9 | 0.062346657338 | 1 in 16 |
| 10 | 0.113677702037 | 1 in 9 |
| 11 | 0.164671200005 | 1 in 6 |
| 12 | 0.1901222602 | 1 in 5 |
| 13 | 0.175132872532 | 1 in 6 |
| 14 | 0.1285740634 | 1 in 8 |
| 15 | 0.074984221403 | 1 in 13 |
| 16 | 0.034540809008 | 1 in 29 |
| 17 | 0.012458867878 | 1 in 80 |
| 18 | 0.003475365511 | 1 in 288 |
| 19 | 0.00073657509 | 1 in 1358 |
| 20 | 0.000115624911 | 1 in 8649 |
| 21 | 0.000012937867 | 1 in 77292 |
| 22 | 0.000000969822 | 1 in 1031117 |
| 23 | 0.000000043401 | 1 in 23041075 |
| 24 | 0.000000000872 | 1 in 1146677515 |
| Total | 1 | 1 in 1 |
Obviously a card with very few odds would have a good running start and a much better chance of winning that a card with mostly odd numbers. In the July 2002 issue of the Las Vegas Advisor I wrote an article about Jumbo Bingo, based on assumption that the cards were created randomly. One reader of that column told me he believed the cards were not created randomly, evidenced by the fact that he purchased 1500 cards and they all had a total number of odds between 9 and 14.
To confirm the accusation that all cards had 9 to 14 odds my assistant Rob Feldheim gathered 259 Jumbo Bingo cards at the Palace Station. We then counted the number of odds on each card and as I feared the total odds were always 9 to 14. The next table shows the total for each number of odds and the expected total in a fair game.
Palace Station cards, actual vs. expected
| Number of Odds |
Number in Sample |
Expected Total |
|---|---|---|
| 0 | 0 | 0 |
| 1 | 0 | 0.000006 |
| 2 | 0 | 0.000139 |
| 3 | 0 | 0.00195 |
| 4 | 0 | 0.018442 |
| 5 | 0 | 0.124528 |
| 6 | 0 | 0.623588 |
| 7 | 0 | 2.374582 |
| 8 | 0 | 6.996572 |
| 9 | 35 | 16.147784 |
| 10 | 35 | 29.442525 |
| 11 | 34 | 42.649841 |
| 12 | 48 | 49.241665 |
| 13 | 55 | 45.359414 |
| 14 | 52 | 33.300682 |
| 15 | 0 | 19.420913 |
| 16 | 0 | 8.94607 |
| 17 | 0 | 3.226847 |
| 18 | 0 | 0.90012 |
| 19 | 0 | 0.190773 |
| 20 | 0 | 0.029947 |
| 21 | 0 | 0.003351 |
| 22 | 0 | 0.000251 |
| 23 | 0 | 0.000011 |
| 24 | 0 | 0 |
| Total | 259 | 259 |
The probability the total number of odds will be between 9 and 14 is 0.834524756. Out of the sample of 42.858088 should have fallen outside the 9 to 14 range but instead none of them did. The probability of this happening in a fair game is 0.834524756259 = 4.4953 * 10-21, or 1 in 222,454,364,282,805,000,000.
Here are the results of the same kind of test done on Grande bingo cards obtained after the 11:00 a.m. session on August 22, 2002, at the Fiesta Rancho.
Fiesta Rancho cards, actual vs. expected
| Number of Odds |
Number in Sample |
Expected Total |
|---|---|---|
| 0 | 0 | 0 |
| 1 | 0 | 0.000002 |
| 2 | 0 | 0.000047 |
| 3 | 0 | 0.000655 |
| 4 | 0 | 0.006195 |
| 5 | 0 | 0.04183 |
| 6 | 0 | 0.209468 |
| 7 | 0 | 0.79764 |
| 8 | 0 | 2.3502 |
| 9 | 10 | 5.424159 |
| 10 | 6 | 9.88996 |
| 11 | 19 | 14.326394 |
| 12 | 18 | 16.540637 |
| 13 | 18 | 15.23656 |
| 14 | 16 | 11.185944 |
| 15 | 0 | 6.523627 |
| 16 | 0 | 3.00505 |
| 17 | 0 | 1.083922 |
| 18 | 0 | 0.302357 |
| 19 | 0 | 0.064082 |
| 20 | 0 | 0.010059 |
| 21 | 0 | 0.001126 |
| 22 | 0 | 0.000084 |
| 23 | 0 | 0.000004 |
| 24 | 0 | 0 |
| Total | 87 | 87 |
Next are the result of my sample of progressive cards from Sams Town.
Sam's Town cards, actual vs. expected
| Number of Evens |
Number in Sample |
Expected Total |
|---|---|---|
| 0 | 0 | 0 |
| 1 | 0 | 0.000002 |
| 2 | 0 | 0.000055 |
| 3 | 0 | 0.000768 |
| 4 | 0 | 0.007263 |
| 5 | 0 | 0.049042 |
| 6 | 0 | 0.245583 |
| 7 | 0 | 0.935164 |
| 8 | 1 | 2.755407 |
| 9 | 1 | 6.359359 |
| 10 | 19 | 11.595126 |
| 11 | 25 | 16.796462 |
| 12 | 24 | 19.392471 |
| 13 | 20 | 17.863553 |
| 14 | 12 | 13.114554 |
| 15 | 0 | 7.648391 |
| 16 | 0 | 3.523163 |
| 17 | 0 | 1.270805 |
| 18 | 0 | 0.354487 |
| 19 | 0 | 0.075131 |
| 20 | 0 | 0.011794 |
| 21 | 0 | 0.00132 |
| 22 | 0 | 0.000099 |
| 23 | 0 | 0.000004 |
| 24 | 0 | 0 |
| Total | 102 | 102 |
I had expected to a range of 10 to 15 odds, or 9 to 14 evens, at Sam's Town, based on conversation with Stephen L. Cavallaro of Station Casinos. However I did get 1 card with 8 evens, and also only 1 with 9. The probability of any given card having 8 to 14 evens is 0.881703. The probability of 102 falling in this range is 2.647786 * 10-6, or 1 in 377,674.
Furthermore I did a similar test on ordinary bingo cards from the Suncoast. A sample of 129 had the following actual and expected results.
Suncoast cards, actual vs. expected
| Number of Odds |
Number in Sample |
Expected Total |
|---|---|---|
| 0 | 0 | 0 |
| 1 | 0 | 0.000003 |
| 2 | 0 | 0.000069 |
| 3 | 0 | 0.000971 |
| 4 | 0 | 0.009185 |
| 5 | 0 | 0.062023 |
| 6 | 0 | 0.31059 |
| 7 | 1 | 1.182707 |
| 8 | 6 | 3.484779 |
| 9 | 5 | 8.042719 |
| 10 | 17 | 14.664424 |
| 11 | 19 | 21.242585 |
| 12 | 29 | 24.525772 |
| 13 | 20 | 22.592141 |
| 14 | 18 | 16.586054 |
| 15 | 10 | 9.672965 |
| 16 | 1 | 4.455764 |
| 17 | 3 | 1.607194 |
| 18 | 2 | 0.448322 |
| 19 | 0 | 0.095018 |
| 20 | 0 | 0.014916 |
| 21 | 0 | 0.001669 |
| 22 | 0 | 0.000125 |
| 23 | 0 | 0.000006 |
| 24 | 0 | 0 |
| Total | 129 | 129 |
Of the 129 cards the number outside the 9 to 14 range was 21, the expected number was 21.34630654. These cards easily passed the odd/even test. They should have since there was no game in which odds or evens were called in advance.
The next table shows the probability of winning in a fair game assuing the player must get a cover all within 50 numbers.
Probability of Winning - Fair Card
| Number of Odds |
Probability of Card |
Probability Card Wins |
Total Probability |
|---|---|---|---|
| 0 | 0.000000000436 | 1 | 0.000000000436 |
| 1 | 0.000000022747 | 0.342105263158 | 0.000000007782 |
| 2 | 0.000000534794 | 0.110953058321 | 0.000000059337 |
| 3 | 0.000007530006 | 0.033902323376 | 0.000000255285 |
| 4 | 0.000071202834 | 0.009686378107 | 0.000000689698 |
| 5 | 0.000480801205 | 0.002564041264 | 0.000001232794 |
| 6 | 0.002407676276 | 0.000621585761 | 0.000001496577 |
| 7 | 0.00916827051 | 0.000135971885 | 0.000001246627 |
| 8 | 0.027013789916 | 0.000026317139 | 0.000000710926 |
| 9 | 0.062346657338 | 0.00000438619 | 0.000000273464 |
| 10 | 0.113677702037 | 0.000000604992 | 0.000000068774 |
| 11 | 0.164671200005 | 0.000000064821 | 0.000000010674 |
| 12 | 0.1901222602 | 0.000000004802 | 0.000000000913 |
| 13 | 0.175132872532 | 0.000000000185 | 0.000000000032 |
| 14 | 0.1285740634 | 0 | 0 |
| 15 | 0.074984221403 | 0 | 0 |
| 16 | 0.034540809008 | 0 | 0 |
| 17 | 0.012458867878 | 0 | 0 |
| 18 | 0.003475365511 | 0 | 0 |
| 19 | 0.00073657509 | 0 | 0 |
| 20 | 0.000115624911 | 0 | 0 |
| 21 | 0.000012937867 | 0 | 0 |
| 22 | 0.000000969822 | 0 | 0 |
| 23 | 0.000000043401 | 0 | 0 |
| 24 | 0.000000000872 | 0 | 0 |
| Total | 1 | 0 | 0.000006053319 |
The lower image--rightell shows the overall probability of winning is 0.000006053319, or 1 in 165199. If there is a win in a fair game note that it is most likely to occur on a card with 6 odds. The probability that a winning card in a fair game having less than 9 odds is 94.15%.
When it became known that I was planning to write about my investigation I was asked to meet with Stephen L. Cavallaro (Executive Vice President & Chief Operating Officer of Station Casinos) and Jonathan Swain (vice president & general manager of the Palace Station). Stephen came right out and admitted the cards were preselected to contain 9 to 14 odds each. He said this was in an effort to level the playing field and give each card and customer hope to win. He also said initially the range was much wider and that the first winner had only 3 odds on the card to begin with. Furthermore he said Sam's Town and Fiesta Casinos were doing the same thing, and that they are the Station game is fully approved by the Nevada Gaming Control Board.
In a follow up phone call Stephen Cavallaro told me that the way the cards are created is that the computer will randomly choose a set of fair numbers. If the total odds are between 9 and 14 it will print the card, otherwise it will discard that set of numbers and go onto the next set. The following table shows the adjusted probability of each number of odds under this method of card creation.
Probability for Total Odd Numbers Station Card
| Number of Odds | Probability |
|---|---|
| 9 | 0.074709 |
| 10 | 0.136218 |
| 11 | 0.197323 |
| 12 | 0.227821 |
| 13 | 0.209859 |
| 14 | 0.154069 |
| Total | 1 |
Overall the result of removing from the best cards from the mix is that the probability of any given card hitting the progressive is substantially less. Removing the worst cards does not compensate. This policy of preselecting cards results in growing larger jackpots. At the same time the casinos have to reseed the meter less frequently. The net result is fewer progressive winners and less total prize money won. The next table shows the expected probability of both a fair card and a Stations card winning according to the number of balls called to win the jackpot.
Expected Probability of Winning
| Number of Calls |
Fair Card | Stations Card | Ratio |
|---|---|---|---|
| 47 | 1 in 1,122,373 | 1 in 205,287,873 | 182.91 |
| 48 | 1 in 583,217 | 1 in 35,037,983 | 60.08 |
| 49 | 1 in 308,005 | 1 in 8,203,638 | 26.63 |
| 50 | 1 in 165,199 | 1 in 2,358,363 | 14.28 |
| 51 | 1 in 89,925 | 1 in 785,008 | 8.73 |
| 52 | 1 in 49,648 | 1 in 291,923 | 5.88 |
| 53 | 1 in 27,784 | 1 in 118,433 | 4.26 |
The ratio column shows how many more times difficult it is to win using a Station casino card as opposed to a fair card. For example it is 14.28 times harder to win if the jackpot must be hit in 50 balls or less.
It is my opinion that all bingo cards should be created truly randomly in the manner suggested above. Barring that, I believe that if a card is not created randomly the rules should be disclosed about the manner in which they are created and the effect on the player. In all forms of gambling I strongly support fairness and disclosure. Neither of these I find to be the case with bingo in the state of Nevada. So let the bingo player beware.
I thank Stephen Cavallaro and Jonathan Swaim for meeting with me and for their openness about this matter.
Go back to probabilities in bingo Michael Shackleford, ASA
 Ohio Recommended Online Casinos
View All
Other Bingo Pages
- My general bingo page
- Palace Station Cash Ball Jackpots for 2007.
- Boulder Station Cash Ball Jackpots for 2007
- Fiesta Henderson Cash Ball Jackpots for 2007
- Texas Station Cash Ball Jackpots for 2007
- Sunset Station Cash Ball Jackpots for 2007
- Santa Fe Station Cash Ball Jackpots for 2007
- Red Rock Cash Ball Jackpots for 2007
- Coast Casinos Cash Ball Jackpots for 2007

