Wizard Recommends
-
 $11000 Welcome Bonus
 -
 $3000 Welcome Bonus
 -
 UP TO $777 BONUS
March Madness 2025
Logic Puzzle
Before we get to this week’s topic of March Madness statistics, it’s time for our usual weekly logic puzzle. Here it is.
Three players play a game. Unseen by the players, three coins are tossed, one for each player. According to the toss of each coin, that player is blindfolded and then given a black or a white hat. The blindfolds are then removed and each player may see the hats of the other two players, but not his own.
Each player is then given a secret ballot to record the color of his hat. The choices are black, white, and pass. For the experiment to be a success, all players who vote white or black must be correct. However, if all three players vote "pass," then the experiment is a failure.
The players are given some time to strategize. What strategy can they employ that will result in a 75% chance of success?
March Madness Update
I used to bet heavily on March Madness proposition bets. A typical example might be an over/under on how many total games would be won by teams in the Pacific 12 conference. To handicap such bets, it was useful to know how many games any given seed could expect to win.
Some bets are resolved in the first round. In particular, will a seed of 13 or more win a game? Here are some examples from Covers from this year.
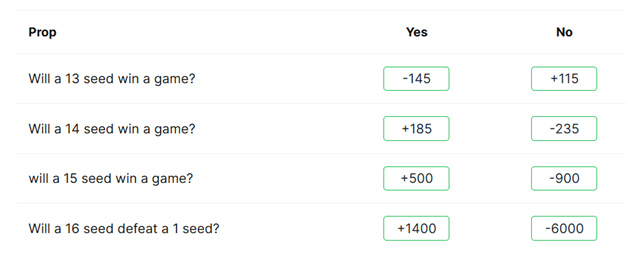
This year, the lowest ranked seed (or highest seed number) to win was 12. So, none of the above bets would have won.
The following table shows the probability any specific seed wins a game in the first round as well as any of the four teams of that seed. It is based on the 40 years of the NCAA tournament from 1985-2025.
| Seed | Specific Team Wins | Any Team Wins First Round |
|---|---|---|
| 1 | 98.75% | 100.00% |
| 2 | 92.50% | 100.00% |
| 3 | 85.63% | 99.96% |
| 4 | 79.38% | 99.82% |
| 5 | 64.38% | 98.39% |
| 6 | 61.25% | 97.75% |
| 7 | 61.25% | 97.75% |
| 8 | 50.00% | 93.75% |
| 9 | 50.00% | 93.75% |
| 10 | 38.75% | 85.93% |
| 11 | 38.75% | 85.93% |
| 12 | 35.63% | 82.83% |
| 13 | 20.63% | 60.31% |
| 14 | 14.38% | 46.25% |
| 15 | 7.50% | 26.79% |
| 16 | 1.25% | 4.91% |
This year, the average seed to survive the first round was 5.34. The overall tournament average is 5.84.
In the second round, the average seed to survive to the Sweet Sixteen was 3.44. The tournament average is 4.52. The lowest rank seed to survive two games was 10. In other words, the underdogs did not do well this year in the first two rounds.
In the third round, the average seed to survive to the Elite Eight was 1.625. The tournament average is 3.30. The lowest rank seed to survive three games was 3 of which there was one only. This ties a tournament record for the lowest rank seed to survive of 3. It has happened twice before, in 2007 and 2009. The average surviving seed of 1.625 sets a new record low in tournament history.
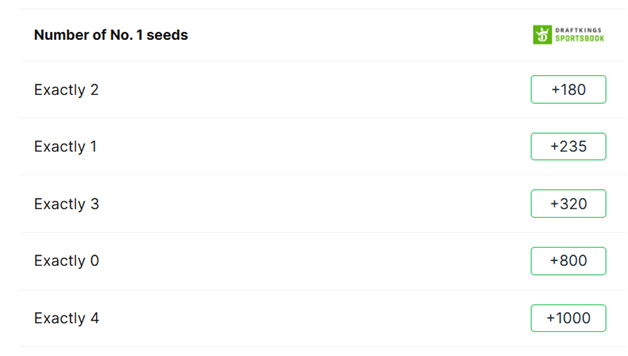
In the Final Four, all four teams were number 1. This has happened only once before in tournament history, in 2008. There is a popular proposition bet on the exact number of One Seeds to make the final four. Here is that bet from Covers this year.
The following table shows how many Number One seeds have made the Final Four in the 40 years of tournament history.
| #1 Seeds | Count | Probability |
|---|---|---|
| 4 | 2 | 5.00% |
| 3 | 4 | 10.00% |
| 2 | 15 | 37.50% |
| 1 | 16 | 40.00% |
| 0 | 3 | 7.50% |
| Total | 40 | 100.00% |
The probability any specific Number One seed makes it to the Final Four is 41.25%.
It goes without saying that with all four teams in the Final Four being a Number One seed, that two One Seeds would make the Championship Game as well as win it.
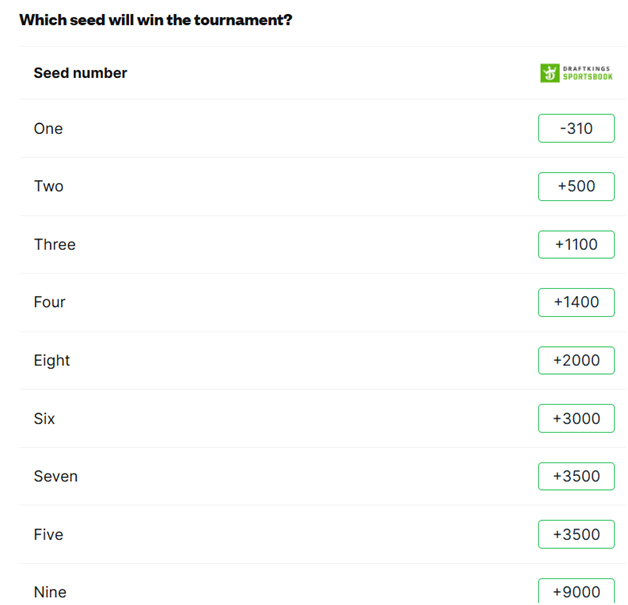
Another proposition bet is the seed to win the Championship Game. Here were the Covers bets this year.
The following table shows how often each seed has won the Championship Game.
| Winning Seed | Count | Probability |
|---|---|---|
| 1 | 26 | 65.00% |
| 2 | 5 | 12.50% |
| 3 | 4 | 10.00% |
| 4 | 2 | 5.00% |
| 5 | 0 | 0.00% |
| 6 | 1 | 2.50% |
| 7 | 1 | 2.50% |
| 8 | 1 | 2.50% |
| 9 to 16 | 0 | 0.00% |
| Total | 40 | 100.00% |
Getting back to the expected wins by seed, here is an updated table, including data from this season.
| Seed | Average wins |
|---|---|
| 1 | 3.34 |
| 2 | 2.33 |
| 3 | 1.84 |
| 4 | 1.56 |
| 5 | 1.14 |
| 6 | 1.06 |
| 7 | 0.89 |
| 8 | 0.73 |
| 9 | 0.59 |
| 10 | 0.61 |
| 11 | 0.64 |
| 12 | 0.51 |
| 13 | 0.24 |
| 14 | 0.16 |
| 15 | 0.11 |
| 16 | 0.01 |
One question I am asked often is the probability of a perfect bracket. Assuming a strategy of always picking the higher seeded game (or lower number) every time, except picking randomly in a 1 vs. 1 situation, my updated probability, including data from this season is 1 in 287,548,153.
Logic Puzzle Answer
The strategy should be as follows:
- • If you see two hats of opposite colors, then pass.
- • If you see two hats of the same color, pick the opposite color.
Here is what we can expect to happen according to the three colors:
- • Three black: All players will see two blacks and vote white. Everyone will be wrong, so the experiment fails.
- • Two black, one white: The white player will see two black hats and correctly vote white. The two black players will see one of each color and pass. Experiment is successful.
- • One black, two white: The black player will see two white hats and correctly vote black. The two white players will see one of each color and pass. Experiment is successful.
- • Three white: All players will see two white and vote black. Everyone will be wrong, so the experiment fails.
The probability of three whites or three blacks is 2*(1/2)³ = 25%. The alternative is a 2-1 split between the two colors, with a 75% probability. As shown above, with a 2-1 split, the experiment will be successful.