Wizard Recommends
-
 $11000 Welcome Bonus
 -
 $3000 Welcome Bonus
 -
 UP TO $777 BONUS
On this page
Variance in Multi-Card Keno
Introduction
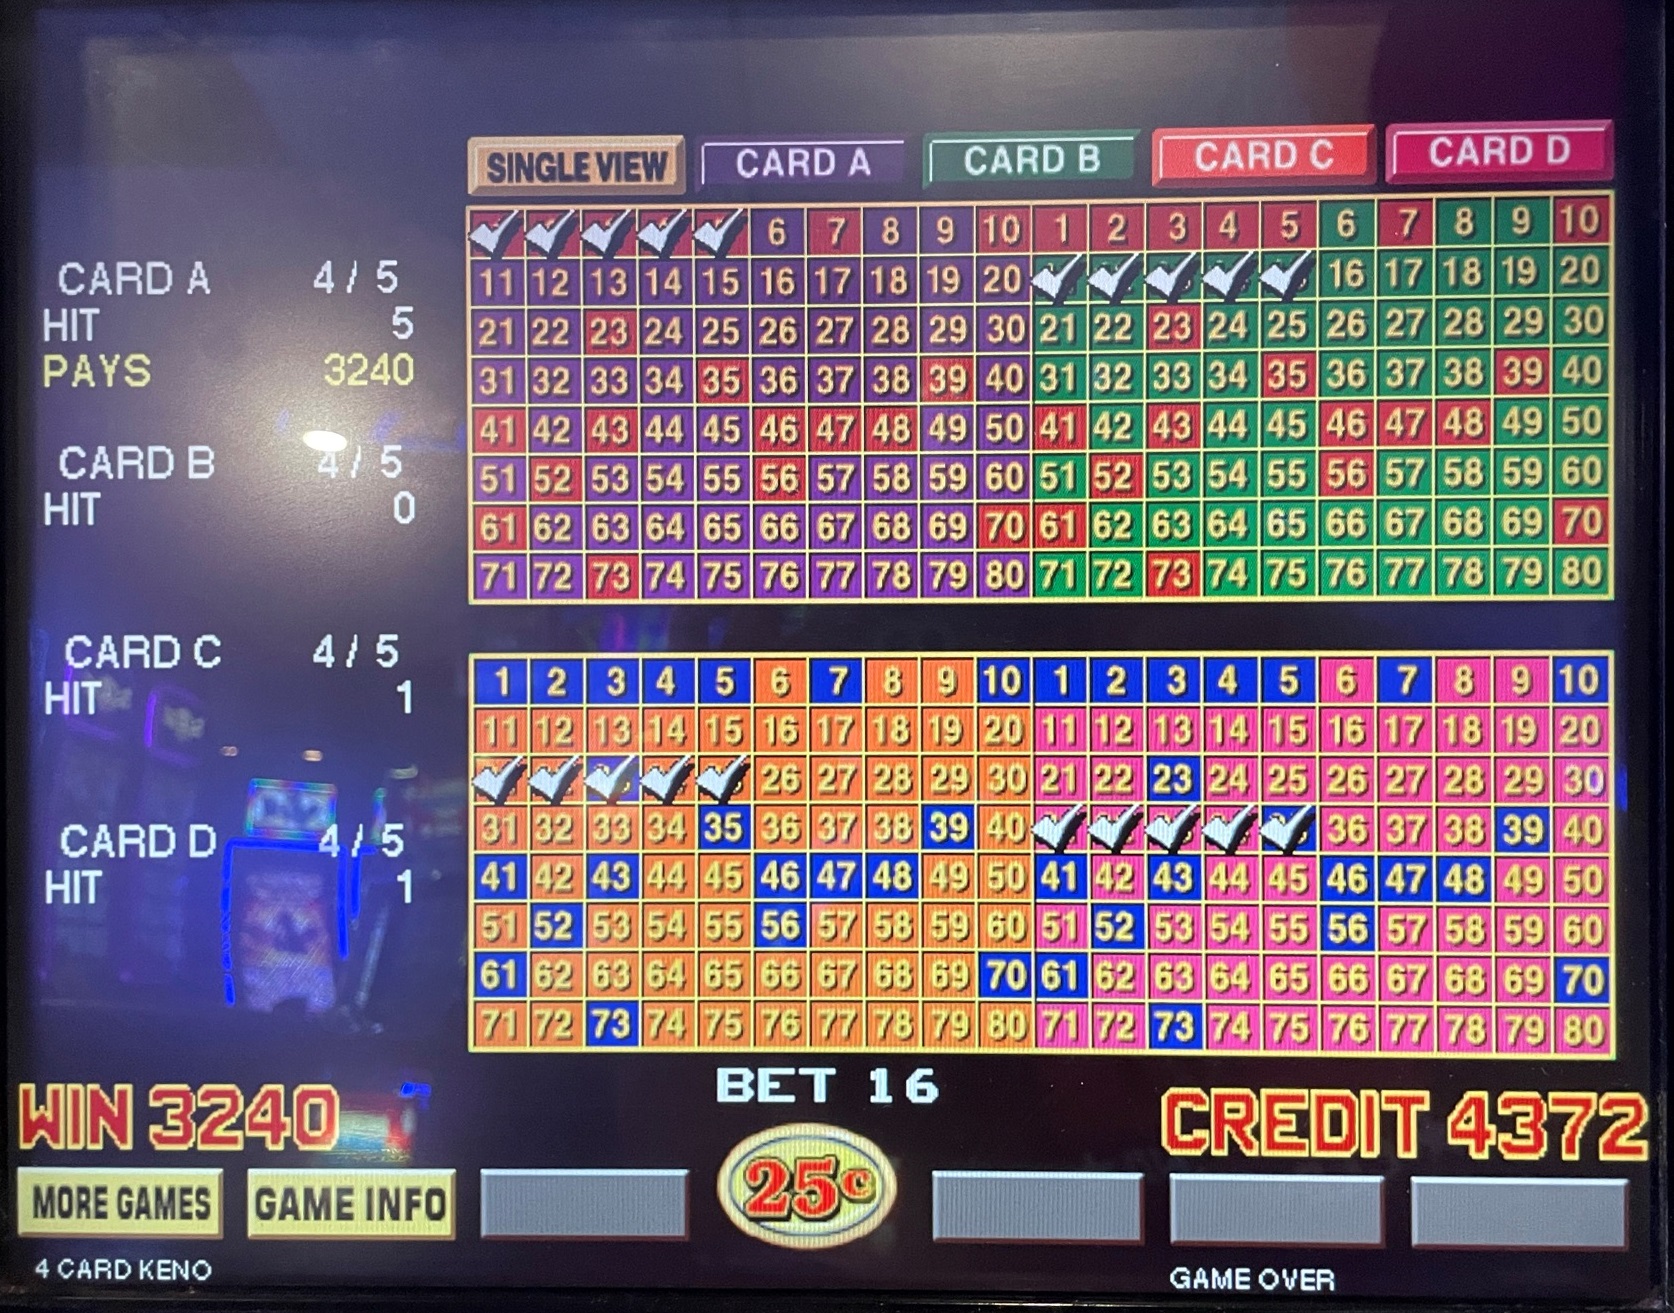
This article looks at variance in multi-card keno. Many video keno games allow the player to play four cards at the same time and others up to 20 cards. The player may control the variance of the game by how many numbers in common his cards have. The more the cards share the same numbers, the greater the variance.
Math Review
Let:
E(x) = Expected value of random varianble X.Cov(x) = The covariance between any two cards.
PThe variance of a single card can be expressed as:
Var(x)=E(x^2)-(E(x))2
When two cards share any of the same numbers the outcomes on each game will be correlated. Usually this correlated relationship is measured by their covariance. The general formula for the covariance between two random variable x and y is:
Cov(x,y) = E(xy) - E(x)*E(y)
If the numbers in common is the same between any two cards, then for n cards the total variance is:
Total covariance = n*Var(x) + n*(n-1)*Cov(x,y)
Pick 6 with 3 Common Numbers
First, let's find the variance of a single card under the typical 3,4,68,1500 pay table. The following table shows the expected win and the square of the win for all possible outcomes.
Pick Six Keno Return Table
| Catch | Pays | Probability | Expected Win |
Expected Win^2 |
|---|---|---|---|---|
| 0 | 0 | 0.166602 | 0.000000 | 0.000000 |
| 1 | 0 | 0.363495 | 0.000000 | 0.000000 |
| 2 | 0 | 0.308321 | 0.000000 | 0.000000 |
| 3 | 3 | 0.129820 | 0.389459 | 1.168376 |
| 4 | 4 | 0.028538 | 0.114152 | 0.456607 |
| 5 | 68 | 0.003096 | 0.210503 | 14.314233 |
| 6 | 1500 | 0.000129 | 0.193477 | 290.216113 |
| Total | 1.000000 | 0.907591 | 306.155328 |
The bottom row shows the expected return is 0.907591 and the expected square of the win is 306.155328. This makes the variance 306.155328 - 0.9075912 = 305.331607.
Next, let's take an in-depth look at the case where the player picks 6 numbers, with 3 in common on all cards and the other 3 with unique numbers on each card. For example, in a 4-card game I might pick:
- Card A: 1,2,3,5,10,15
- Card B: 1,2,3,20,25,30
- Card C: 1,2,3,35,40,45
- Card D: 1,2,3,50,55,60
The following table shows the probability of all 49 possible combinations of the number of catches between two cards, A and B, that share three out of six numbers. Along the left column is the number of catches on card A and along the top row is the number of catches on card B.
Combined Probability Table -- Pick 6 with 3 Common Numbers
| Catches | Catch 0 | Catch 1 | Catch 2 | Catch 3 | Catch 4 | Catch 5 | Catch 6 | Total |
|---|---|---|---|---|---|---|---|---|
| 0 | 0.063748 | 0.073555 | 0.026369 | 0.002930 | 0.000000 | 0.000000 | 0.000000 | 0.166602 |
| 1 | 0.073555 | 0.152662 | 0.105475 | 0.029086 | 0.002717 | 0.000000 | 0.000000 | 0.363495 |
| 2 | 0.026369 | 0.105475 | 0.113626 | 0.051596 | 0.010479 | 0.000776 | 0.000000 | 0.308321 |
| 3 | 0.002930 | 0.029086 | 0.051596 | 0.034435 | 0.010316 | 0.001389 | 0.000068 | 0.129820 |
| 4 | 0.000000 | 0.002717 | 0.010479 | 0.010316 | 0.004216 | 0.000761 | 0.000049 | 0.028538 |
| 5 | 0.000000 | 0.000000 | 0.000776 | 0.001389 | 0.000761 | 0.000159 | 0.000011 | 0.003096 |
| 6 | 0.000000 | 0.000000 | 0.000000 | 0.000068 | 0.000049 | 0.000011 | 0.000001 | 0.000129 |
| Total | 0.166602 | 0.363495 | 0.308321 | 0.129820 | 0.028538 | 0.003096 | 0.000129 | 1.000000 |
The next table shows the product of the wins between both cards.
Win Product Table -- Pick 6
| Catches | Catch 0 | Catch 1 | Catch 2 | Catch 3 | Catch 4 | Catch 5 | Catch 6 |
|---|---|---|---|---|---|---|---|
| 0 | 0 | 0 | 0 | 0 | 0 | 0 | 0 |
| 1 | 0 | 0 | 0 | 0 | 0 | 0 | 0 |
| 2 | 0 | 0 | 0 | 0 | 0 | 0 | 0 |
| 3 | 0 | 0 | 0 | 9 | 12 | 204 | 4500 |
| 4 | 0 | 0 | 0 | 12 | 16 | 272 | 6000 |
| 5 | 0 | 0 | 0 | 204 | 272 | 4624 | 102000 |
| 6 | 0 | 0 | 0 | 4500 | 6000 | 102000 | 2250000 |
The next table is the product of the two tables above, to get the expected product of the wins between both cards. The lower right cell shows the expected win product is 7.390131.
Expected Win Product Table -- Pick 6 with 3 Common Numbers
| Catches | Catch 0 | Catch 1 | Catch 2 | Catch 3 | Catch 4 | Catch 5 | Catch 6 | Total |
|---|---|---|---|---|---|---|---|---|
| 0 | 0.000000 | 0.000000 | 0.000000 | 0.000000 | 0.000000 | 0.000000 | 0.000000 | 0.000000 |
| 1 | 0.000000 | 0.000000 | 0.000000 | 0.000000 | 0.000000 | 0.000000 | 0.000000 | 0.000000 |
| 2 | 0.000000 | 0.000000 | 0.000000 | 0.000000 | 0.000000 | 0.000000 | 0.000000 | 0.000000 |
| 3 | 0.000000 | 0.000000 | 0.000000 | 0.309916 | 0.123788 | 0.283363 | 0.306405 | 1.023472 |
| 4 | 0.000000 | 0.000000 | 0.000000 | 0.123788 | 0.067463 | 0.206918 | 0.295839 | 0.694008 |
| 5 | 0.000000 | 0.000000 | 0.000000 | 0.283363 | 0.206918 | 0.734216 | 1.108143 | 2.332641 |
| 6 | 0.000000 | 0.000000 | 0.000000 | 0.306405 | 0.295839 | 1.108143 | 1.629623 | 3.340010 |
| Total | 0.000000 | 0.000000 | 0.000000 | 1.023472 | 0.694008 | 2.332641 | 3.340010 | 7.390131 |
The covariance between the two cards is thus 7.390131 - 0.9075912 = 6.566409.
The following table shows the variance and standard deviation for playing 1 to 20 cards, both for all cards combined and per card.
Pick 6 with 3 Common Numbers -- Variance Summary
| Cards | Total Variance |
Variance per Card |
Total Std. Dev. |
Std. Dev. per Card |
|---|---|---|---|---|
| 1 | 305.33 | 305.33 | 17.47 | 17.47 |
| 2 | 623.80 | 311.90 | 24.98 | 17.66 |
| 3 | 955.39 | 318.46 | 30.91 | 17.85 |
| 4 | 1300.12 | 325.03 | 36.06 | 18.03 |
| 5 | 1657.99 | 331.60 | 40.72 | 18.21 |
| 6 | 2028.98 | 338.16 | 45.04 | 18.39 |
| 7 | 2413.11 | 344.73 | 49.12 | 18.57 |
| 8 | 2810.37 | 351.30 | 53.01 | 18.74 |
| 9 | 3220.77 | 357.86 | 56.75 | 18.92 |
| 10 | 3644.29 | 364.43 | 60.37 | 19.09 |
| 11 | 4080.95 | 371.00 | 63.88 | 19.26 |
| 12 | 4530.75 | 377.56 | 67.31 | 19.43 |
| 13 | 4993.67 | 384.13 | 70.67 | 19.60 |
| 14 | 5469.73 | 390.69 | 73.96 | 19.77 |
| 15 | 5958.92 | 397.26 | 77.19 | 19.93 |
| 16 | 6461.24 | 403.83 | 80.38 | 20.10 |
| 17 | 6976.70 | 410.39 | 83.53 | 20.26 |
| 18 | 7505.29 | 416.96 | 86.63 | 20.42 |
| 19 | 8047.01 | 423.53 | 89.71 | 20.58 |
| 20 | 8601.87 | 430.09 | 92.75 | 20.74 |
Pick 10 with 5 Common Numbers
The following table shows the expected win and the expected square of the win for pick-10 keno under the 3-4-68-1500 pay table.
Pick Ten Keno Return Table
| Catch | Pays | Probability | Expected Win |
Expected Win^2 |
|---|---|---|---|---|
| 0 | 0 | 0.045791 | 0.000000 | 0.000000 |
| 1 | 0 | 0.179571 | 0.000000 | 0.000000 |
| 2 | 0 | 0.295257 | 0.000000 | 0.000000 |
| 3 | 0 | 0.267402 | 0.000000 | 0.000000 |
| 4 | 0 | 0.147319 | 0.000000 | 0.000000 |
| 5 | 5 | 0.051428 | 0.257138 | 1.285692 |
| 6 | 23 | 0.011479 | 0.264026 | 6.072600 |
| 7 | 132 | 0.001611 | 0.212671 | 28.072557 |
| 8 | 1000 | 0.000135 | 0.135419 | 135.419355 |
| 9 | 4500 | 0.000006 | 0.027543 | 123.943139 |
| 10 | 10000 | 0.000000 | 0.001122 | 11.221190 |
| Total | 1.000000 | 0.897920 | 306.014533 |
The bottom row shows the expected return is 0.897920 and the expected square of the win is 306.014533. This makes the variance 306.014533 - 0.897920^2 = 305.208273.
After a lot of math, which I will omit, the covariance is 9.998613.
The following table shows the variance and standard deviation for playing 1 to 9 cards, both for all cards combined and per card.
Total Variance and Standard Deviation -- Pick 10 with 5 Common Numbers
| Cards | Total Variance |
Variance per Card |
Total Std. Dev. |
Std. Dev. per Card |
|---|---|---|---|---|
| 1 | 305.21 | 305.21 | 17.47 | 17.47 |
| 2 | 630.41 | 315.21 | 25.11 | 17.75 |
| 3 | 975.62 | 325.21 | 31.23 | 18.03 |
| 4 | 1340.82 | 335.20 | 36.62 | 18.31 |
| 5 | 1726.01 | 345.20 | 41.55 | 18.58 |
| 6 | 2131.21 | 355.20 | 46.17 | 18.85 |
| 7 | 2556.40 | 365.20 | 50.56 | 19.11 |
| 8 | 3001.59 | 375.20 | 54.79 | 19.37 |
| 9 | 3466.77 | 385.20 | 58.88 | 19.63 |
| 10 | 3951.96 | 395.20 | 62.86 | 19.88 |
| 11 | 4457.14 | 405.19 | 66.76 | 20.13 |
| 12 | 4982.32 | 415.19 | 70.59 | 20.38 |
| 13 | 5527.49 | 425.19 | 74.35 | 20.62 |
| 14 | 6092.66 | 435.19 | 78.06 | 20.86 |
| 15 | 6677.83 | 445.19 | 81.72 | 21.10 |

Pick 9 with 3 Common Numbers
The following table shows the expected win and the expected square of the win for pick-9 keno under the 1-6-44-300-4700-10000 pay table.
Pick Ten Keno Return Table
| Catch | Pays | Probability | Expected Win |
Expected Win^2 |
|---|---|---|---|---|
| 0 | 0 | 0.063748 | 0.000000 | 0.000000 |
| 1 | 0 | 0.220666 | 0.000000 | 0.000000 |
| 2 | 0 | 0.316426 | 0.000000 | 0.000000 |
| 3 | 0 | 0.246109 | 0.000000 | 0.000000 |
| 4 | 1 | 0.114105 | 0.114105 | 0.114105 |
| 5 | 6 | 0.032601 | 0.195609 | 1.173653 |
| 6 | 44 | 0.005720 | 0.251661 | 11.073064 |
| 7 | 300 | 0.000592 | 0.177504 | 53.251057 |
| 8 | 4700 | 0.000033 | 0.153185 | 719.967331 |
| 9 | 10000 | 0.000001 | 0.007243 | 72.427678 |
| Total | 1.000000 | 0.899305 | 858.006889 |
The bottom row shows the expected return is 0.899305 and the expected square of the win is 858.006889. This makes the variance 858.006889 - 0.8993052 = 857.198138.
After a lot of math, which I will omit, the covariance is 3.401478.
The following table shows the variance and standard deviation for playing 1 to 12 cards, both for all cards combined and per card.
Total Variance and Standard Deviation -- Pick 9 with 3 Common Numbers
| Cards | Total Variance |
Variance per Card |
Total Std. Dev. |
Std. Dev. per Card |
|---|---|---|---|---|
| 1 | 857.20 | 857.20 | 29.28 | 29.28 |
| 2 | 1721.20 | 860.60 | 41.49 | 29.34 |
| 3 | 2592.00 | 864.00 | 50.91 | 29.39 |
| 4 | 3469.61 | 867.40 | 58.90 | 29.45 |
| 5 | 4354.02 | 870.80 | 65.99 | 29.51 |
| 6 | 5245.23 | 874.21 | 72.42 | 29.57 |
| 7 | 6143.25 | 877.61 | 78.38 | 29.62 |
| 8 | 7048.07 | 881.01 | 83.95 | 29.68 |
| 9 | 7959.69 | 884.41 | 89.22 | 29.74 |
| 10 | 8878.11 | 887.81 | 94.22 | 29.80 |
| 11 | 9803.34 | 891.21 | 99.01 | 29.85 |
| 12 | 10735.37 | 894.61 | 103.61 | 29.91 |
Pick 9 with 6 Common Numbers
The expected return table for a single card is shown above for the pick 9 with 3 common numbers case. As a reminder, the variance is 857.198138.
After a lot of math, which I will omit, the covariance for two pick-9 cards with six common numbers is 57.283444.
The following table shows the variance and standard deviation for playing 1 to 20 cards, both for all cards combined and per card.
Total Variance and Standard Deviation -- Pick 9 with 6 Common Numbers
| Cards | Total Variance |
Variance per Card |
Total Std. Dev. |
Std. Dev. per Card |
|---|---|---|---|---|
| 1 | 857.20 | 857.20 | 29.28 | 29.28 |
| 2 | 1828.96 | 914.48 | 42.77 | 30.24 |
| 3 | 2915.30 | 971.77 | 53.99 | 31.17 |
| 4 | 4116.19 | 1029.05 | 64.16 | 32.08 |
| 5 | 5431.66 | 1086.33 | 73.70 | 32.96 |
| 6 | 6861.69 | 1143.62 | 82.84 | 33.82 |
| 7 | 8406.29 | 1200.90 | 91.69 | 34.65 |
| 8 | 10065.46 | 1258.18 | 100.33 | 35.47 |
| 9 | 11839.19 | 1315.47 | 108.81 | 36.27 |
| 10 | 13727.49 | 1372.75 | 117.16 | 37.05 |
| 11 | 15730.36 | 1430.03 | 125.42 | 37.82 |
| 12 | 17847.79 | 1487.32 | 133.60 | 38.57 |
| 13 | 20079.79 | 1544.60 | 141.70 | 39.30 |
| 14 | 22426.36 | 1601.88 | 149.75 | 40.02 |
| 15 | 24887.50 | 1659.17 | 157.76 | 40.73 |
| 16 | 27463.20 | 1716.45 | 165.72 | 41.43 |
| 17 | 30153.47 | 1773.73 | 173.65 | 42.12 |
| 18 | 32958.30 | 1831.02 | 181.54 | 42.79 |
| 19 | 35877.70 | 1888.30 | 189.41 | 43.45 |
| 20 | 38911.67 | 1945.58 | 197.26 | 44.11 |
Summary
The following table shows the pertinent statistics for all the above cases as well as every number of picks from 2 to 10 with no overlapping numbers.
Summary
| Picks | Pay Table | Overlapping Numbers |
Variance | Covariance | |
|---|---|---|---|---|---|
| 2 | 14 | 0 | 0.841772 | 11.076230 | -0.108155 |
| 3 | 2,45 | 0 | 0.901899 | 27.839208 | -0.205128 |
| 4 | 2,5,85 | 0 | 0.901899 | 23.251327 | -0.183044 |
| 5 | 3,11,804 | 0 | 0.901899 | 418.292207 | -0.441581 |
| 6 | 3,4,68,1500 | 0 | 0.903340 | 305.331607 | -0.376538 |
| 7 | 1,2,20,390,7000 | 0 | 0.908473 | 1310.087945 | -0.518283 |
| 8 | 2,12,98,1550,10000 | 0 | 0.906738 | 844.928926 | -0.603251 |
| 9 | 1,6,44,300,4700,10000 | 0 | 0.899305 | 857.198138 | -0.609176 |
| 10 | 5,23,132,1000,4500,10000 | 0 | 0.897920 | 305.208273 | -0.631869 |
| 6 | 3,4,68,1500 | 3 | 0.903340 | 305.331607 | 6.566409 |
| 9 | 1,6,44,300,4700,10000 | 3 | 0.899305 | 857.198138 | 3.401478 |
| 9 | 1,6,44,300,4700,10000 | 6 | 0.899305 | 857.198138 | 57.283444 |
| 10 | 5,23,132,1000,4500,10000 | 5 | 0.897920 | 305.208273 | 9.998613 |
Example
How is all this helpful? Here is an example math problem where the information above will prove helpful.
Joe plays 10,000 games of four-card keno. In each game he picks three common numbers between all four cards and the other three numbers per card are all unique. He bets $1 per card. The 3-4-68-1500 pay table is used. What is a 95% confidence interval for his total expected win?
Click the button below for the answer.
Click the button below for a brief solution.
The expected win is 10,000 × 4 × $1 × (0.907591-1) = -3,696.35.
The appropriate table above shows that the variance per card is 325.0308343. With 40,000 total cards, the total variance is 40,000 × 325.0308343 = $13,001,233.
The square root of the variance is the standard deviation, which equals sqrt($13,001,233) = $3,605.72.
A 95% confidence interval spans 1.959964 standard deviations in either directions. This means that 95% of the time the actual win will be within 1.959964 × $3,605.72 = $7,067.09 of expectations.
Thus, the lower bound of the 95% confidence interval is -$3,696.35 - $7,067.09 = -$10,763.44.
The upper bound of the 95% confidence interval is -$3,696.35 + $7,067.09 = $3,370.73.