Wizard Recommends
-
 $11000 Welcome Bonus
 -
 $3000 Welcome Bonus
 -
 UP TO $777 BONUS
Ask The Wizard #285
Where can I find the official definition of full pay video poker? And what is it?
I don't think there is an official source for the definition, but I would personally define it as the best standard pay table for any given video poker game. This does not include gimmicks or promotional pay tables, but ordinary pay tables that have been seen many times in land casinos.
As a source for what exactly is the "full pay" table for any given game I turned to my bible of video poker, vpFREE2. Here is a partial list of "full pay" games.
Full Pay Video Poker
| Game | Pay Table | Return |
|---|---|---|
| Aces Bonus | 8-5 | 99.40% |
| Aces and Eights | 8-5 | 99.78% |
| All American | 40-8-8-8 | 100.72% |
| Black Jack Bonus | 9-7 | 99.44% |
| Bonus Deuces Wild | 9-4-4 | 99.45% |
| Bonus Poker | 8-5 | 99.17% |
| Deuces Joker Wild | 12-9-6 | 99.07% |
| Deuces Wild | 25-15-9-5 | 100.76% |
| Double Bonus | 10-7 | 100.17% |
| Double Bonus Aces and Faces | 9-7 | 99.24% |
| Double Bonus Deuces Wild | 12-4-3 | 99.81% |
| Double Deuces Wild | 800-25-16-11 | 99.62% |
| Double Double Bonus | 9-6 | 98.98% |
| Joker Poker (kings or better) | 800-20-7 | 100.65% |
| Joker Poker (two pair or better) | 1000-10-6 | 99.92% |
| Loose Deuces | 15-8 | 100.15% |
| Super Aces | 60-50-8 | 99.94% |
| Super Double Bonus | 80-9-5 | 99.69% |
| Super Double Double Bonus | 50-8-5 | 99.69% |
| White Hot Aces | 80-9-5 | 99.57% |
The "pay table" column includes those pays that vary from one pay table to another. Unless otherwise noted, the pay for a royal is 800, with no bonus for a sequential royal.
For the full list of full pay games, please visit vpFREE2.
In your trail description of the River Mountains Loop you took a photo of a large letter B on the side of a hill. What does it stand for?

According to Wizard of Vegas forum member BeachBumBabs, the B was created and still maintained by students of Basic High School in Henderson. They have maintained either this one, or an earlier version elsewhere, since the school opened in 1951. The current one is large enough to be noted on aviation maps.
Thank you for your work on half-point parlay cards. In the post season there aren't as many games so they sometimes have a pick on which half of the game will have more points. Specifically, the first half -0.5 or second half +0.5. Which is better and is it good enough to bet on a parlay card?
Here is some data from the 2000 to 2013 seasons.
Half with More Points
| Half with More Points | Count | Percentage |
|---|---|---|
| First | 1,849 | 49.87% |
| Second | 1,725 | 46.52% |
| Tie | 134 | 3.61% |
| Total | 3,708 | 100.00% |
By giving the second half the extra half point, it is like giving it all games where the first half and second half end in a tie for the most points. The data suggests that picking the second half +0.5 is marginally the better choice, with a probability of winning of 50.13%. You need a much higher probability than that to compensate for the low payoffs on a half-point card. My advice would be to not mess with half point cards at all in the post season.
Have you heard of the Lion's Share slot machine at the MGM Grand? Rumor has it that it is the oldest machine in the MGM and they can't get rid of it until the progressive hits. Given that the jackpot has not hit in about 15 years, do you think it is a good bet?
I hope you're happy. As of this writing I've played that game 1,421 times at $3 a pop and kept records of every spin. Add to that 153 spins from a YouTube video. After doing all the math, I get a return of 106.2%. However, more play is needed to have any confidence about the actual return. I should add that if we consider taxes on the jackpot it would almost certainly be negative.
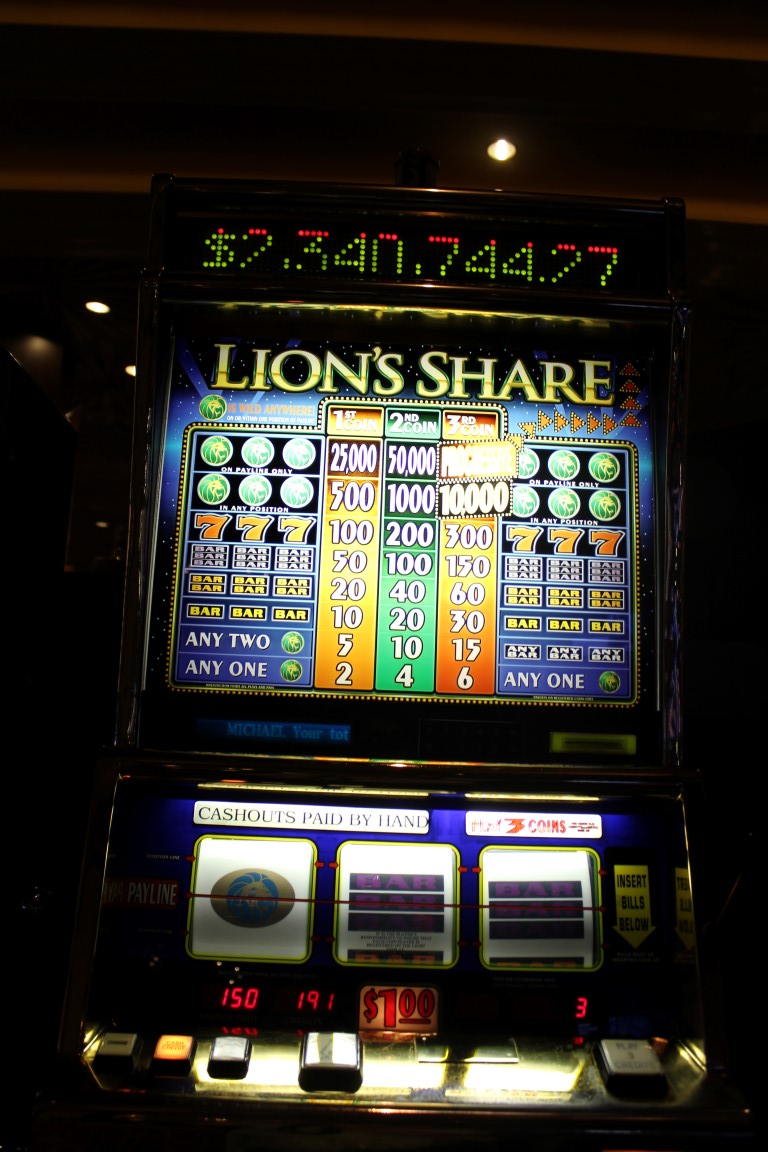
For more information, have a sneak preview of my upcoming page Deconstructing Lion's Share.
Warren Buffet is offering one billion dollars to anyone who can predict a perfect March Madness bracket? What would be your strategy and what are the odds of winning?
Lots of people have asked me about that. For those unfamiliar with March Madness, it is a single-elimination basketball tournament between 64 teams. Actually, there are extra games to get into the final 64, but Warren isn't looking at those.
In the 64-game format, it takes 32+16+8+4+2+1=63 games to determine a winner. If one were to guess randomly, then the probability of getting all of them correct would be (1/2)63 = 1 in 9,223,372,036,854,780,000.
However, one can significantly improve his odds by always picking the higher ranked team in each game. The following table shows the probability of the higher ranked team winning each possible match-up under this strategy, based on March Madness data since its inception in 1985. For the three games where a 1 seed plays another 1 seed, I assume a 50% chance of picking correctly.
March Madness — Wizard Strategy to Perfect Bracket
| Match | Games | Wins | Prob. Win | Number Games | Prob. All Winners |
|---|---|---|---|---|---|
| 1 vs 16 | 116 | 116 | 1.000000 | 4 | 1.000000 |
| 8 vs 9 | 116 | 58 | 0.500000 | 4 | 0.062500 |
| 5 vs 12 | 116 | 75 | 0.646552 | 4 | 0.174748 |
| 4 vs 13 | 116 | 91 | 0.784483 | 4 | 0.378733 |
| 6 vs 11 | 116 | 78 | 0.672414 | 4 | 0.204431 |
| 3 vs 14 | 116 | 99 | 0.853448 | 4 | 0.530529 |
| 7 vs 10 | 116 | 70 | 0.603448 | 4 | 0.132605 |
| 2 vs 15 | 116 | 108 | 0.931034 | 4 | 0.751386 |
| 1 vs 8 | 60 | 49 | 0.816667 | 4 | 0.444815 |
| 4 vs 5 | 62 | 34 | 0.548387 | 4 | 0.090438 |
| 3 vs 6 | 64 | 36 | 0.562500 | 4 | 0.100113 |
| 2 vs 7 | 66 | 50 | 0.757576 | 4 | 0.329385 |
| 1 vs 4 | 52 | 36 | 0.692308 | 4 | 0.229719 |
| 2 vs 3 | 48 | 29 | 0.604167 | 4 | 0.133238 |
| 1 vs 2 | 56 | 31 | 0.553571 | 4 | 0.093906 |
| 1 vs 1 | 0.500000 | 3 | 0.125000 | ||
Explanation of the columns:
- Match: This shows the seeds of the two teams playing. The lower the number the higher the rank.
- Games: How many games have been played with this scenario.
- Wins: How often the higher ranked seed has won.
- Prob. Win: Ratio of wins to games.
- Number of Games: Number of such match-ups if the higher ranked team always wins.
- Prob. all Winners: The probability of winning each such match up. This would be the Prob. Win column to the power of the Number of Games.
If you take the product of every probability in the right column, then you get a probability of 1 in 46,940,073,802. Suffice it to say, about 1 in 47 billion. Not counting the consolation prizes, a free entry would have an expected value of 1/47 = 2.13¢.
I'm sure I'm not the only one to think of this strategy. My advice would be to not pick the higher ranked team in every single game. You'll notice in the games between an 8 and 9 seed, the 8 seed wins 50% of the time only. So, I would at least throw in some 9 seed picks. Maybe at least one 10 seed as well.
For more information, read the article Warren Buffett: $1 billion to whoever calls winners of all March Madness games in the New York Daily News.