Wizard Recommends
-
 $250 Welcome Bonus
 -
 $150 Sign-Up Bonus
 -
 $20 Risk Free Bet
On this page
Super Bowl Squares
Introduction
Super Bowl Squares generally refers to gambling on the terminal digit of the total points of each team in the Super Bowl. It can be done at the end of the game only or quarter by quarter. It is generally done among friends, with nobody raking the pot, where everybody has an equal chance.
For Super Bowl 54, the Circa Sports Books in Las Vegas (found at the D and Golden Gate) offered 400 bets where the player got to choose his own squares. This page primarily looks at probability of all 400 bets winning and the value of each bet.
Randomized Version
I imagine most people finding this page may be more interested in how to conduct what I will call the randomized version of Super Bowl Squares. This is usually done among friends, where nobody rakes the pot. It is a fun way for people to gambling on the Super Bowl who have no idea what to bet on and/or don't care who wins. Following is the way that is generally done.
- A 10x10 grid will be drawn, forming 100 squares, like on a Battleship board.
- A price will be determined per square, for example $10.
- Rules should be established on how the prize pool will be split, for example 20% for quarters 1, 2, and 3, and 40% for the final score.
- One team should be written down along the left or right of the grid and other team along the top or bottom.
- Buyers will pick squares on the grid, according to the number purchased, and write their names in each.
- After all squares have been purchased or it's determined there are unlikely to be more buyers, then whoever is running the pool will get 10 playing cards, from A to 9 and one face card. Each rank shall have a value as follows:
- A = one point.
- 2-9 = pip value.
- Face card = 0 points.
- The cards shall be shuffled and then in a systematic way one assigned to each row of the grid. The end result should be each row labeled with a number from 0 to 9 in a random manner.
- The same process shall be repeated for the columns.
- The end result should look something like the following example.
- After each quarter and the end of the game the terminal digit of the score of each team shall be noted. Looking up the row and column headings for that score, the winner of that quarter/game shall be determined.
- In the event the winner is an empty square, rules should be established in advance on what to do. For example, roll the prize money over to the next quarter/end of game. If the end of game result is an empty square, a rule should be set in advance on what to do, like give the money to the quarter winners on a pro-rata basis or deal cards to determine the winner.
Following is a Super Bowl Squares Example.
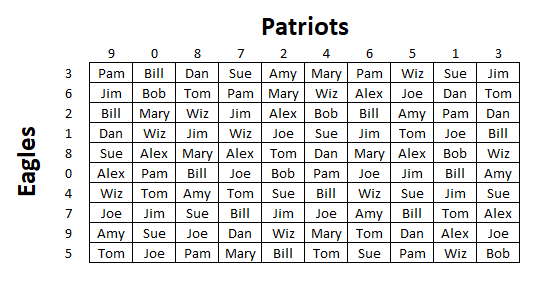
Let's look at an example, based on the 2018 Super Bowl. Here was the box score.
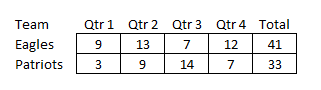
At the end of the first quarter the score was Eagles 9 and Patriots 3. Going across the 9 row and down the 3 column we find that Joe is the winner of the first quarter.
At the end of the second quarter the score was Eagles 22 and Patriots 12. The terminal digits of the scores are Eagles 2 and Patriots 2. Going across the 2 row and down the 2 column we find that Alex is the winner of the second quarter.
At the end of the third quarter the score was Eagles 29 and Patriots 26. The terminal digits of the scores are Eagles 9 and Patriots 6. Going across the 9 row and down the 6 column we find that Tom is the winner of the third quarter.
At the end of the game the score was Eagles 41 and Patriots 33. The terminal digits of the scores are Eagles 1 and Patriots 3. Going across the 1 row and down the 3 column we find that Bill is the winner of the game.
Per the distribution arrangement, Joe, Alex, and Tom would each get $200 and Bill $400.
Pick Your Own Square
The Circa sports book, which can be found at the D and Golden Gate in Las Vegas, offered bets on non-randomized Super Bowl squares. In other words, the player got to choose the terminal digit of both teams. They offered these bets for the first three quarters and the full game, so 400 total bets.
To analyze them, I looked at every NFL game from the 2000 to 2014 seasons, which consisted of 3,985 games. The following four tables show the distribution of the terminal digit of each team for each game. I counted each game twice, flipping the scores, for purposes of a larger sample size and gaining symmetry.
First Quarter
| Team 1 | Team 2 | |||||||||
|---|---|---|---|---|---|---|---|---|---|---|
| 0 | 1 | 2 | 3 | 4 | 5 | 6 | 7 | 8 | 9 | |
| 0 | 1532 | 23 | 9 | 681 | 274 | 5 | 108 | 986 | 4 | 19 |
| 1 | 23 | 0 | 0 | 5 | 3 | 0 | 1 | 11 | 0 | 0 |
| 2 | 9 | 0 | 0 | 0 | 3 | 0 | 0 | 8 | 1 | 0 |
| 3 | 681 | 5 | 0 | 260 | 66 | 0 | 28 | 393 | 0 | 7 |
| 4 | 274 | 3 | 3 | 66 | 20 | 0 | 2 | 109 | 0 | 0 |
| 5 | 5 | 0 | 0 | 0 | 0 | 0 | 0 | 4 | 0 | 0 |
| 6 | 108 | 1 | 0 | 28 | 2 | 0 | 0 | 44 | 0 | 0 |
| 7 | 986 | 11 | 8 | 393 | 109 | 4 | 44 | 568 | 0 | 1 |
| 8 | 4 | 0 | 1 | 0 | 0 | 0 | 0 | 0 | 0 | 0 |
| 9 | 19 | 0 | 0 | 7 | 0 | 0 | 0 | 1 | 0 | 0 |
Second Quarter
| Team 1 | Team 2 | |||||||||
|---|---|---|---|---|---|---|---|---|---|---|
| 0 | 1 | 2 | 3 | 4 | 5 | 6 | 7 | 8 | 9 | |
| 0 | 566 | 105 | 22 | 400 | 289 | 18 | 183 | 486 | 33 | 44 |
| 1 | 105 | 20 | 6 | 78 | 51 | 2 | 31 | 107 | 1 | 7 |
| 2 | 22 | 6 | 2 | 4 | 16 | 1 | 4 | 20 | 0 | 1 |
| 3 | 400 | 78 | 4 | 254 | 179 | 13 | 115 | 343 | 14 | 31 |
| 4 | 289 | 51 | 16 | 179 | 144 | 9 | 82 | 247 | 12 | 22 |
| 5 | 18 | 2 | 1 | 13 | 9 | 0 | 2 | 19 | 2 | 1 |
| 6 | 183 | 31 | 4 | 115 | 82 | 2 | 38 | 126 | 8 | 18 |
| 7 | 486 | 107 | 20 | 343 | 247 | 19 | 126 | 486 | 29 | 47 |
| 8 | 33 | 1 | 0 | 14 | 12 | 2 | 8 | 29 | 0 | 0 |
| 9 | 44 | 7 | 1 | 31 | 22 | 1 | 18 | 47 | 0 | 4 |
Third Quarter
| Team 1 | Team 2 | |||||||||
|---|---|---|---|---|---|---|---|---|---|---|
| 0 | 1 | 2 | 3 | 4 | 5 | 6 | 7 | 8 | 9 | |
| 0 | 342 | 116 | 49 | 294 | 222 | 25 | 141 | 380 | 61 | 46 |
| 1 | 116 | 72 | 9 | 84 | 105 | 14 | 44 | 152 | 24 | 21 |
| 2 | 49 | 9 | 2 | 19 | 28 | 3 | 7 | 41 | 5 | 7 |
| 3 | 294 | 84 | 19 | 252 | 185 | 18 | 114 | 249 | 52 | 42 |
| 4 | 222 | 105 | 28 | 185 | 200 | 22 | 90 | 271 | 37 | 32 |
| 5 | 25 | 14 | 3 | 18 | 22 | 6 | 3 | 31 | 2 | 2 |
| 6 | 141 | 44 | 7 | 114 | 90 | 3 | 52 | 125 | 21 | 15 |
| 7 | 380 | 152 | 41 | 249 | 271 | 31 | 125 | 342 | 72 | 51 |
| 8 | 61 | 24 | 5 | 52 | 37 | 2 | 21 | 72 | 14 | 9 |
| 9 | 46 | 21 | 7 | 42 | 32 | 2 | 15 | 51 | 9 | 8 |
End of Game
| Team 1 | Team 2 | |||||||||
|---|---|---|---|---|---|---|---|---|---|---|
| 0 | 1 | 2 | 3 | 4 | 5 | 6 | 7 | 8 | 9 | |
| 0 | 158 | 104 | 56 | 279 | 177 | 46 | 112 | 280 | 82 | 46 |
| 1 | 104 | 42 | 20 | 93 | 189 | 33 | 52 | 139 | 90 | 45 |
| 2 | 56 | 20 | 4 | 31 | 38 | 19 | 19 | 44 | 13 | 26 |
| 3 | 279 | 93 | 31 | 110 | 121 | 31 | 127 | 184 | 59 | 64 |
| 4 | 177 | 189 | 38 | 121 | 134 | 46 | 73 | 285 | 72 | 50 |
| 5 | 46 | 33 | 19 | 31 | 46 | 8 | 19 | 65 | 42 | 15 |
| 6 | 112 | 52 | 19 | 127 | 73 | 19 | 46 | 98 | 37 | 43 |
| 7 | 280 | 139 | 44 | 184 | 285 | 65 | 98 | 170 | 70 | 73 |
| 8 | 82 | 90 | 13 | 59 | 72 | 42 | 37 | 70 | 30 | 20 |
| 9 | 46 | 45 | 26 | 64 | 50 | 15 | 43 | 73 | 20 | 14 |
The following four tables show the probability of each square winning, based on the data above.
First Quarter
| Team 1 | Team 2 | |||||||||
|---|---|---|---|---|---|---|---|---|---|---|
| 0 | 1 | 2 | 3 | 4 | 5 | 6 | 7 | 8 | 9 | |
| 0 | 0.192221 | 0.002886 | 0.001129 | 0.085445 | 0.034379 | 0.000627 | 0.013551 | 0.123714 | 0.000502 | 0.002384 |
| 1 | 0.002886 | 0.000000 | 0.000000 | 0.000627 | 0.000376 | 0.000000 | 0.000125 | 0.001380 | 0.000000 | 0.000000 |
| 2 | 0.001129 | 0.000000 | 0.000000 | 0.000000 | 0.000376 | 0.000000 | 0.000000 | 0.001004 | 0.000125 | 0.000000 |
| 3 | 0.085445 | 0.000627 | 0.000000 | 0.032622 | 0.008281 | 0.000000 | 0.003513 | 0.049310 | 0.000000 | 0.000878 |
| 4 | 0.034379 | 0.000376 | 0.000376 | 0.008281 | 0.002509 | 0.000000 | 0.000251 | 0.013676 | 0.000000 | 0.000000 |
| 5 | 0.000627 | 0.000000 | 0.000000 | 0.000000 | 0.000000 | 0.000000 | 0.000000 | 0.000502 | 0.000000 | 0.000000 |
| 6 | 0.013551 | 0.000125 | 0.000000 | 0.003513 | 0.000251 | 0.000000 | 0.000000 | 0.005521 | 0.000000 | 0.000000 |
| 7 | 0.123714 | 0.001380 | 0.001004 | 0.049310 | 0.013676 | 0.000502 | 0.005521 | 0.071267 | 0.000000 | 0.000125 |
| 8 | 0.000502 | 0.000000 | 0.000125 | 0.000000 | 0.000000 | 0.000000 | 0.000000 | 0.000000 | 0.000000 | 0.000000 |
| 9 | 0.002384 | 0.000000 | 0.000000 | 0.000878 | 0.000000 | 0.000000 | 0.000000 | 0.000125 | 0.000000 | 0.000000 |
Second Quarter
| Team 1 | Team 2 | |||||||||
|---|---|---|---|---|---|---|---|---|---|---|
| 0 | 1 | 2 | 3 | 4 | 5 | 6 | 7 | 8 | 9 | |
| 0 | 0.071016 | 0.013174 | 0.002760 | 0.050188 | 0.036261 | 0.002258 | 0.022961 | 0.060979 | 0.004141 | 0.005521 |
| 1 | 0.013174 | 0.002509 | 0.000753 | 0.009787 | 0.006399 | 0.000251 | 0.003890 | 0.013425 | 0.000125 | 0.000878 |
| 2 | 0.002760 | 0.000753 | 0.000251 | 0.000502 | 0.002008 | 0.000125 | 0.000502 | 0.002509 | 0.000000 | 0.000125 |
| 3 | 0.050188 | 0.009787 | 0.000502 | 0.031870 | 0.022459 | 0.001631 | 0.014429 | 0.043036 | 0.001757 | 0.003890 |
| 4 | 0.036261 | 0.006399 | 0.002008 | 0.022459 | 0.018068 | 0.001129 | 0.010289 | 0.030991 | 0.001506 | 0.002760 |
| 5 | 0.002258 | 0.000251 | 0.000125 | 0.001631 | 0.001129 | 0.000000 | 0.000251 | 0.002384 | 0.000251 | 0.000125 |
| 6 | 0.022961 | 0.003890 | 0.000502 | 0.014429 | 0.010289 | 0.000251 | 0.004768 | 0.015809 | 0.001004 | 0.002258 |
| 7 | 0.060979 | 0.013425 | 0.002509 | 0.043036 | 0.030991 | 0.002384 | 0.015809 | 0.060979 | 0.003639 | 0.005897 |
| 8 | 0.004141 | 0.000125 | 0.000000 | 0.001757 | 0.001506 | 0.000251 | 0.001004 | 0.003639 | 0.000000 | 0.000000 |
| 9 | 0.005521 | 0.000878 | 0.000125 | 0.003890 | 0.002760 | 0.000125 | 0.002258 | 0.005897 | 0.000000 | 0.000502 |
Third Quarter
| Team 1 | Team 2 | |||||||||
|---|---|---|---|---|---|---|---|---|---|---|
| 0 | 1 | 2 | 3 | 4 | 5 | 6 | 7 | 8 | 9 | |
| 0 | 0.042911 | 0.014555 | 0.006148 | 0.036888 | 0.027854 | 0.003137 | 0.017691 | 0.047679 | 0.007654 | 0.005772 |
| 1 | 0.014555 | 0.009034 | 0.001129 | 0.010540 | 0.013174 | 0.001757 | 0.005521 | 0.019072 | 0.003011 | 0.002635 |
| 2 | 0.006148 | 0.001129 | 0.000251 | 0.002384 | 0.003513 | 0.000376 | 0.000878 | 0.005144 | 0.000627 | 0.000878 |
| 3 | 0.036888 | 0.010540 | 0.002384 | 0.031619 | 0.023212 | 0.002258 | 0.014304 | 0.031242 | 0.006524 | 0.005270 |
| 4 | 0.027854 | 0.013174 | 0.003513 | 0.023212 | 0.025094 | 0.002760 | 0.011292 | 0.034003 | 0.004642 | 0.004015 |
| 5 | 0.003137 | 0.001757 | 0.000376 | 0.002258 | 0.002760 | 0.000753 | 0.000376 | 0.003890 | 0.000251 | 0.000251 |
| 6 | 0.017691 | 0.005521 | 0.000878 | 0.014304 | 0.011292 | 0.000376 | 0.006524 | 0.015684 | 0.002635 | 0.001882 |
| 7 | 0.047679 | 0.019072 | 0.005144 | 0.031242 | 0.034003 | 0.003890 | 0.015684 | 0.042911 | 0.009034 | 0.006399 |
| 8 | 0.007654 | 0.003011 | 0.000627 | 0.006524 | 0.004642 | 0.000251 | 0.002635 | 0.009034 | 0.001757 | 0.001129 |
| 9 | 0.005772 | 0.002635 | 0.000878 | 0.005270 | 0.004015 | 0.000251 | 0.001882 | 0.006399 | 0.001129 | 0.001004 |
End of Game
| Team 1 | Team 2 | |||||||||
|---|---|---|---|---|---|---|---|---|---|---|
| 0 | 1 | 2 | 3 | 4 | 5 | 6 | 7 | 8 | 9 | |
| 0 | 0.019824 | 0.013049 | 0.007026 | 0.035006 | 0.022208 | 0.005772 | 0.014053 | 0.035132 | 0.010289 | 0.005772 |
| 1 | 0.013049 | 0.005270 | 0.002509 | 0.011669 | 0.023714 | 0.004141 | 0.006524 | 0.017440 | 0.011292 | 0.005646 |
| 2 | 0.007026 | 0.002509 | 0.000502 | 0.003890 | 0.004768 | 0.002384 | 0.002384 | 0.005521 | 0.001631 | 0.003262 |
| 3 | 0.035006 | 0.011669 | 0.003890 | 0.013802 | 0.015182 | 0.003890 | 0.015935 | 0.023087 | 0.007403 | 0.008030 |
| 4 | 0.022208 | 0.023714 | 0.004768 | 0.015182 | 0.016813 | 0.005772 | 0.009159 | 0.035759 | 0.009034 | 0.006274 |
| 5 | 0.005772 | 0.004141 | 0.002384 | 0.003890 | 0.005772 | 0.001004 | 0.002384 | 0.008156 | 0.005270 | 0.001882 |
| 6 | 0.014053 | 0.006524 | 0.002384 | 0.015935 | 0.009159 | 0.002384 | 0.005772 | 0.012296 | 0.004642 | 0.005395 |
| 7 | 0.035132 | 0.017440 | 0.005521 | 0.023087 | 0.035759 | 0.008156 | 0.012296 | 0.021330 | 0.008783 | 0.009159 |
| 8 | 0.010289 | 0.011292 | 0.001631 | 0.007403 | 0.009034 | 0.005270 | 0.004642 | 0.008783 | 0.003764 | 0.002509 |
| 9 | 0.005772 | 0.005646 | 0.003262 | 0.008030 | 0.006274 | 0.001882 | 0.005395 | 0.009159 | 0.002509 | 0.001757 |
The tables above show that the count of some squares is zero, especially for the first quarter. However, the probability of a future game falling in that square is clearly greater than zero. To estimate the probability in such situations, I looked at just the terminal digit for each team for each game by quarter, without considering its correlation to the opposing teams digit. The following table shows the summary.
Individual Terminal Digits — Count
| Digit | Qtr 1 | Qtr 2 | Qtr 3 | Game |
|---|---|---|---|---|
| 0 | 3,641 | 2,146 | 1,676 | 1,340 |
| 1 | 43 | 408 | 641 | 807 |
| 2 | 21 | 76 | 170 | 270 |
| 3 | 1,440 | 1,431 | 1,309 | 1,099 |
| 4 | 477 | 1,051 | 1,192 | 1,185 |
| 5 | 9 | 67 | 126 | 324 |
| 6 | 183 | 607 | 612 | 626 |
| 7 | 2,124 | 1,910 | 1,714 | 1,408 |
| 8 | 5 | 99 | 297 | 515 |
| 9 | 27 | 175 | 233 | 396 |
| Total | 7,970 | 7,970 | 7,970 | 7,970 |
Following is the same information in probability form.
Individual Terminal Digits — Probability
| Digit | Qtr 1 | Qtr 2 | Qtr 3 | Game |
|---|---|---|---|---|
| 0 | 0.456838 | 0.269260 | 0.210289 | 0.168130 |
| 1 | 0.005395 | 0.051192 | 0.080427 | 0.101255 |
| 2 | 0.002635 | 0.009536 | 0.021330 | 0.033877 |
| 3 | 0.180678 | 0.179548 | 0.164241 | 0.137892 |
| 4 | 0.059849 | 0.131870 | 0.149561 | 0.148683 |
| 5 | 0.001129 | 0.008407 | 0.015809 | 0.040652 |
| 6 | 0.022961 | 0.076161 | 0.076788 | 0.078545 |
| 7 | 0.266499 | 0.239649 | 0.215056 | 0.176662 |
| 8 | 0.000627 | 0.012422 | 0.037265 | 0.064617 |
| 9 | 0.003388 | 0.021957 | 0.029235 | 0.049686 |
An example of where this might be helpful is in analyzing the Circa bet on terminal digits of 5 for the Chiefs and 1 for the 49'ers in the first quarter, paying 10,000 to 1 (or +1,000,000 in the American odds format). Such a pairing has never happened in the 15 seasons used for this page. However, we can see that at the end of the first quarter the probability the terminal digit is a 5 of any given team is 0.001129 and for a terminal digit of 1 is 0.005395. One could estimate the probability of that bet winning as 0.001129 × 0.005395 = 0.00000609, or 1 in 164,137. That makes my estimate of the return of this bet 10,001/164,137 = 6.09%. In other words, a house edge of 93.91%.
The following tables show the return of all 400 bets available. It is based on the direct count of all combinations 10 by 10 combinations of terminal digits in the data available when such count is greater than 0. When it is 0, I used the single-team probabilities.
First Quarter Return Table
| Team 1 | Team 2 | |||||||||
|---|---|---|---|---|---|---|---|---|---|---|
| 0 | 1 | 2 | 3 | 4 | 5 | 6 | 7 | 8 | 9 | |
| 0 | 99.95% | 43.58% | 33.99% | 81.17% | 61.88% | 47.11% | 55.56% | 74.23% | 25.14% | 71.76% |
| 1 | 43.58% | 5.82% | 7.11% | 15.75% | 18.86% | 6.09% | 9.42% | 20.84% | 1.69% | 9.14% |
| 2 | 33.99% | 7.11% | 3.47% | 14.28% | 11.33% | 2.98% | 6.05% | 25.19% | 94.12% | 4.46% |
| 3 | 81.17% | 15.75% | 14.28% | 61.98% | 19.05% | 20.40% | 26.70% | 54.24% | 8.50% | 65.96% |
| 4 | 61.88% | 18.86% | 11.33% | 19.05% | 12.80% | 13.52% | 3.79% | 28.72% | 3.75% | 15.21% |
| 5 | 47.11% | 6.09% | 2.98% | 20.40% | 13.52% | 1.28% | 7.78% | 37.69% | 0.71% | 3.83% |
| 6 | 55.56% | 9.42% | 6.05% | 26.70% | 3.79% | 7.78% | 13.18% | 28.16% | 4.32% | 7.78% |
| 7 | 74.23% | 20.84% | 25.19% | 54.24% | 28.72% | 37.69% | 28.16% | 53.45% | 8.36% | 3.78% |
| 8 | 25.14% | 1.69% | 94.12% | 8.50% | 3.75% | 0.71% | 4.32% | 8.36% | 0.20% | 1.06% |
| 9 | 71.76% | 9.14% | 4.46% | 65.96% | 15.21% | 3.83% | 0.78% | 3.78% | 1.06% | 5.74% |
Second Quarter Return Table
| Team 1 | Team 2 | |||||||||
|---|---|---|---|---|---|---|---|---|---|---|
| 0 | 1 | 2 | 3 | 4 | 5 | 6 | 7 | 8 | 9 | |
| 0 | 92.32% | 47.43% | 41.68% | 80.30% | 61.64% | 39.75% | 71.18% | 79.27% | 31.47% | 41.96% |
| 1 | 47.43% | 25.35% | 37.72% | 49.91% | 39.03% | 12.57% | 29.56% | 36.25% | 2.52% | 17.65% |
| 2 | 41.68% | 37.72% | 75.31% | 10.09% | 50.39% | 12.56% | 25.14% | 50.44% | 5.92% | 18.83% |
| 3 | 80.30% | 49.91% | 10.09% | 82.86% | 58.39% | 32.79% | 73.59% | 73.16% | 17.74% | 58.73% |
| 4 | 61.64% | 39.03% | 50.39% | 58.39% | 46.98% | 22.70% | 62.76% | 58.88% | 18.97% | 48.58% |
| 5 | 39.75% | 12.57% | 12.56% | 32.79% | 22.70% | 7.07% | 7.55% | 41.96% | 18.85% | 12.56% |
| 6 | 71.18% | 29.56% | 25.14% | 73.59% | 62.76% | 7.55% | 60.08% | 64.82% | 15.16% | 67.98% |
| 7 | 79.27% | 36.25% | 50.44% | 73.16% | 58.88% | 41.96% | 64.82% | 97.57% | 27.65% | 59.56% |
| 8 | 31.47% | 2.52% | 5.92% | 17.74% | 18.97% | 18.85% | 15.16% | 27.65% | 4.63% | 13.64% |
| 9 | 41.96% | 17.65% | 18.83% | 58.73% | 48.58% | 12.56% | 67.98% | 59.56% | 13.64% | 50.24% |
Third Quarter Return Table
| Team 1 | Team 2 | |||||||||
|---|---|---|---|---|---|---|---|---|---|---|
| 0 | 1 | 2 | 3 | 4 | 5 | 6 | 7 | 8 | 9 | |
| 0 | 68.66% | 45.12% | 92.84% | 77.47% | 52.92% | 19.13% | 54.84% | 76.29% | 31.38% | 43.86% |
| 1 | 45.12% | 55.11% | 33.99% | 53.75% | 67.19% | 26.52% | 55.76% | 78.19% | 30.41% | 52.96% |
| 2 | 92.84% | 33.99% | 25.12% | 41.96% | 61.83% | 18.86% | 22.05% | 77.68% | 18.88% | 44.00% |
| 3 | 77.47% | 53.75% | 41.96% | 113.83% | 71.96% | 28.46% | 144.47% | 65.61% | 39.80% | 79.57% |
| 4 | 52.92% | 67.19% | 61.83% | 71.96% | 77.79% | 27.88% | 91.47% | 71.41% | 28.32% | 60.63% |
| 5 | 19.13% | 26.52% | 18.86% | 28.46% | 27.88% | 18.90% | 7.57% | 23.73% | 5.04% | 7.55% |
| 6 | 54.84% | 55.76% | 22.05% | 144.47% | 91.47% | 7.57% | 114.83% | 64.30% | 39.79% | 47.24% |
| 7 | 76.29% | 78.19% | 77.68% | 65.61% | 71.41% | 23.73% | 64.30% | 81.53% | 46.07% | 64.63% |
| 8 | 31.38% | 30.41% | 18.88% | 39.80% | 28.32% | 5.04% | 39.79% | 46.07% | 26.52% | 31.17% |
| 9 | 43.86% | 52.96% | 44.00% | 79.57% | 60.63% | 7.55% | 47.24% | 64.63% | 31.17% | 30.21% |
End of Game Return Table
| Team 1 | Team 2 | |||||||||
|---|---|---|---|---|---|---|---|---|---|---|
| 0 | 1 | 2 | 3 | 4 | 5 | 6 | 7 | 8 | 9 | |
| 0 | 101.10% | 66.55% | 70.97% | 91.02% | 79.95% | 58.29% | 85.72% | 73.78% | 62.76% | 58.29% |
| 1 | 66.55% | 26.88% | 31.62% | 71.18% | 45.06% | 31.47% | 65.90% | 88.95% | 29.36% | 71.14% |
| 2 | 70.97% | 31.62% | 15.11% | 49.01% | 48.16% | 14.54% | 36.00% | 69.56% | 20.55% | 32.95% |
| 3 | 91.02% | 71.18% | 49.01% | 91.09% | 92.61% | 29.56% | 81.27% | 117.74% | 56.26% | 101.18% |
| 4 | 79.95% | 45.06% | 48.16% | 92.61% | 68.93% | 43.86% | 69.61% | 67.94% | 46.07% | 79.05% |
| 5 | 58.29% | 31.47% | 14.54% | 29.56% | 43.86% | 10.14% | 30.04% | 61.98% | 18.97% | 28.42% |
| 6 | 85.72% | 65.90% | 36.00% | 81.27% | 69.61% | 30.04% | 101.58% | 93.45% | 35.28% | 41.00% |
| 7 | 73.78% | 88.95% | 69.56% | 117.74% | 67.94% | 61.98% | 93.45% | 87.45% | 44.79% | 69.61% |
| 8 | 62.76% | 29.36% | 20.55% | 56.26% | 46.07% | 18.97% | 35.28% | 44.79% | 19.20% | 31.62% |
| 9 | 58.29% | 71.14% | 32.95% | 101.18% | 79.05% | 28.42% | 41.00% | 69.61% | 31.62% | 52.87% |
Disclaimer
This page is based on NFL averages only. There is no such thing as an "average game." For example, the over/under on the 2020 Super Bowl is 54, which is much higher than the NFL average. If this game is this high-scoring, then other quarterly totals, and thus terminal digits, are likely to be hit.
It should also be noted that the NFL in general has been a higher scoring game since the close of the data used in 2014, probably due to new rules curbing aggressive and possibly dangerous defenses.
I would like to add that if you made every bet in proportion to what it would pay on a win, thus making yourself indifferent to what happened because every winning ticket would be worth the same, then the overall return would be 60%, or a 40% house edge.
All that said, please take the returns posted here with a grain of salt.