Wizard Recommends
-
 $11000 Welcome Bonus
 -
 $3000 Welcome Bonus
 -
 UP TO $777 BONUS
On this page
Top, Bottom, Left, Right and Edge Keno
Introduction
Top Bottom Keno is a keno game in which the player selects either numbers 1 to 40 or 41 to 80. He is paid according to the number of catches in the chosen half. Sometimes the player can also bet on the left side, right side, and edge numbers, which are also addressed.
Rules
- The player shall pick either Top or Bottom. If the player picks Top, then he shall cover numbers 1 to 40. If he picks Bottom, then 41 to 80.
- The game shall draw 20 balls randomly and without replacement from a pool of balls numbered 1 to 80.
- The player shall be paid according to how many balls in the 20-ball draw that fall in the player's chosen half. This is known as the number of catches. An example pay table is below.
The following table shows the three Pay Tables (PT) I am aware of. The bottom row shows the return to player (RTP).
Pay Tables
| Catches | PT 1 | PT 2 | PT 3 | PT 4 |
|---|---|---|---|---|
| 0 or 20 | 12500 | 12500 | 12500 | 12500 |
| 1 or 19 | 5000 | 5000 | 5000 | 5000 |
| 2 or 18 | 492 | 434 | 558 | 1000 |
| 3 or 17 | 122 | 125 | 180 | 200 |
| 4 or 16 | 28 | 30 | 32 | 40 |
| 5 or 15 | 11 | 12 | 12 | 10 |
| 6 or 14 | 3 | 3 | 3 | 3 |
| 7 or 13 | 2 | 2 | 2 | 1 |
| 12 | 1 | 1 | 1 | 0 |
| Return | 88.32% | 90.32% | 94.32% | 72.29% |
Example
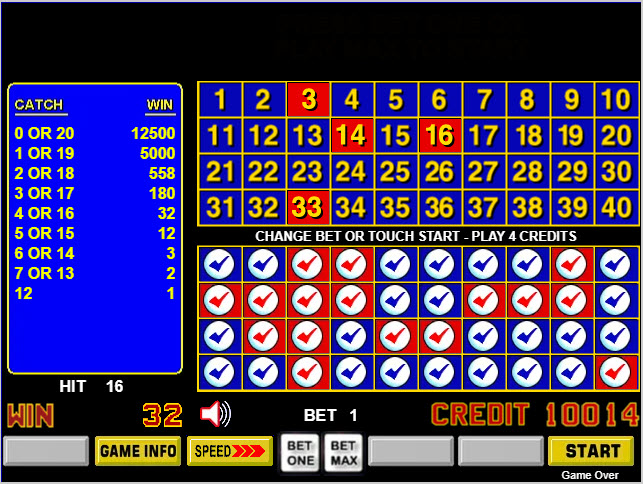
In the image below I bet the bottom 40 numbers. I bet one credit and caught 16 out of 20, for a win of 32.
Analysis
The following table shows the probability and contribution to the return of all possible number of catches from 0 to 20 for pay table 1. The lower right cell shows a return of 88.32%.
Pay Table 1 Analysis
| Catches | Pays | Combinations | Probability | Return |
|---|---|---|---|---|
| 0 | 12,500 | 137,846,528,820 | 0.00000004 | 0.000487 |
| 1 | 5,000 | 5,251,296,336,000 | 0.00000149 | 0.007427 |
| 2 | 492 | 88,436,604,204,000 | 0.00002502 | 0.012307 |
| 3 | 122 | 876,675,902,544,001 | 0.00024798 | 0.030253 |
| 4 | 28 | 5,744,053,569,793,500 | 0.00162476 | 0.045493 |
| 5 | 11 | 26,468,598,849,608,400 | 0.00748691 | 0.082356 |
| 6 | 3 | 89,077,015,359,259,200 | 0.02519634 | 0.075589 |
| 7 | 2 | 224,342,112,756,653,000 | 0.06345744 | 0.126915 |
| 8 | - | 429,655,207,020,554,000 | 0.12153233 | 0.000000 |
| 9 | - | 632,136,396,535,987,000 | 0.17880619 | 0.000000 |
| 10 | - | 718,528,370,729,238,000 | 0.20324303 | 0.000000 |
| 11 | - | 632,136,396,535,987,000 | 0.17880619 | 0.000000 |
| 12 | 1 | 429,655,207,020,554,000 | 0.12153233 | 0.121532 |
| 13 | 2 | 224,342,112,756,653,000 | 0.06345744 | 0.126915 |
| 14 | 3 | 89,077,015,359,259,200 | 0.02519634 | 0.075589 |
| 15 | 11 | 26,468,598,849,608,400 | 0.00748691 | 0.082356 |
| 16 | 28 | 5,744,053,569,793,500 | 0.00162476 | 0.045493 |
| 17 | 122 | 876,675,902,544,001 | 0.00024798 | 0.030253 |
| 18 | 492 | 88,436,604,204,000 | 0.00002502 | 0.012307 |
| 19 | 5,000 | 5,251,296,336,000 | 0.00000149 | 0.007427 |
| 20 | 12,500 | 137,846,528,820 | 0.00000004 | 0.000487 |
| Total | 3,535,316,142,212,170,000 | 1.00000000 | 0.883189 |
The following table shows the probability and contribution to the return of all possible number of catches from 0 to 20 for pay table 1. The lower right cell shows a return of 90.32%.
Pay Table 2 Analysis
| Catches | Pays | Combinations | Probability | Return |
|---|---|---|---|---|
| 0 | 12,500 | 137,846,528,820 | 0.000000 | 0.000487 |
| 1 | 5,000 | 5,251,296,336,000 | 0.000001 | 0.007427 |
| 2 | 434 | 88,436,604,204,000 | 0.000025 | 0.010857 |
| 3 | 125 | 876,675,902,544,001 | 0.000248 | 0.030997 |
| 4 | 30 | 5,744,053,569,793,500 | 0.001625 | 0.048743 |
| 5 | 12 | 26,468,598,849,608,400 | 0.007487 | 0.089843 |
| 6 | 3 | 89,077,015,359,259,200 | 0.025196 | 0.075589 |
| 7 | 2 | 224,342,112,756,653,000 | 0.063457 | 0.126915 |
| 8 | - | 429,655,207,020,554,000 | 0.121532 | 0.000000 |
| 9 | - | 632,136,396,535,987,000 | 0.178806 | 0.000000 |
| 10 | - | 718,528,370,729,238,000 | 0.203243 | 0.000000 |
| 11 | - | 632,136,396,535,987,000 | 0.178806 | 0.000000 |
| 12 | 1 | 429,655,207,020,554,000 | 0.121532 | 0.121532 |
| 13 | 2 | 224,342,112,756,653,000 | 0.063457 | 0.126915 |
| 14 | 3 | 89,077,015,359,259,200 | 0.025196 | 0.075589 |
| 15 | 12 | 26,468,598,849,608,400 | 0.007487 | 0.089843 |
| 16 | 30 | 5,744,053,569,793,500 | 0.001625 | 0.048743 |
| 17 | 125 | 876,675,902,544,001 | 0.000248 | 0.030997 |
| 18 | 434 | 88,436,604,204,000 | 0.000025 | 0.010857 |
| 19 | 5,000 | 5,251,296,336,000 | 0.000001 | 0.007427 |
| 20 | 12,500 | 137,846,528,820 | 0.000000 | 0.000487 |
| Total | 3,535,316,142,212,170,000 | 1.000000 | 0.903248 |
The following table shows the probability and contribution to the return of all possible number of catches from 0 to 20 for pay table 3. The lower right cell shows a return of 94.32%.
Pay Table 3 Analysis
| Catches | Pays | Combinations | Probability | Return |
|---|---|---|---|---|
| 0 | 12,500 | 137,846,528,820 | 0.000000 | 0.000487 |
| 1 | 5,000 | 5,251,296,336,000 | 0.000001 | 0.007427 |
| 2 | 558 | 88,436,604,204,000 | 0.000025 | 0.013958 |
| 3 | 180 | 876,675,902,544,001 | 0.000248 | 0.044636 |
| 4 | 32 | 5,744,053,569,793,500 | 0.001625 | 0.051992 |
| 5 | 12 | 26,468,598,849,608,400 | 0.007487 | 0.089843 |
| 6 | 3 | 89,077,015,359,259,200 | 0.025196 | 0.075589 |
| 7 | 2 | 224,342,112,756,653,000 | 0.063457 | 0.126915 |
| 8 | - | 429,655,207,020,554,000 | 0.121532 | 0.000000 |
| 9 | - | 632,136,396,535,987,000 | 0.178806 | 0.000000 |
| 10 | - | 718,528,370,729,238,000 | 0.203243 | 0.000000 |
| 11 | - | 632,136,396,535,987,000 | 0.178806 | 0.000000 |
| 12 | 1 | 429,655,207,020,554,000 | 0.121532 | 0.121532 |
| 13 | 2 | 224,342,112,756,653,000 | 0.063457 | 0.126915 |
| 14 | 3 | 89,077,015,359,259,200 | 0.025196 | 0.075589 |
| 15 | 12 | 26,468,598,849,608,400 | 0.007487 | 0.089843 |
| 16 | 32 | 5,744,053,569,793,500 | 0.001625 | 0.051992 |
| 17 | 180 | 876,675,902,544,001 | 0.000248 | 0.044636 |
| 18 | 558 | 88,436,604,204,000 | 0.000025 | 0.013958 |
| 19 | 5,000 | 5,251,296,336,000 | 0.000001 | 0.007427 |
| 20 | 12,500 | 137,846,528,820 | 0.000000 | 0.000487 |
| Total | 3,535,316,142,212,170,000 | 1.000000 | 0.943228 |
The following table shows the probability and contribution to the return of all possible number of catches from 0 to 20 for pay table 4. The lower right cell shows a return of 72.29%.
Pay Table 4 Analysis
| Catches | Pays | Combinations | Probability | Return |
|---|---|---|---|---|
| 0 | 12,500 | 137,846,528,820 | 0.000000 | 0.000487 |
| 1 | 5,000 | 5,251,296,336,000 | 0.000001 | 0.007427 |
| 2 | 1,000 | 88,436,604,204,000 | 0.000025 | 0.025015 |
| 3 | 200 | 876,675,902,544,001 | 0.000248 | 0.049595 |
| 4 | 40 | 5,744,053,569,793,500 | 0.001625 | 0.064991 |
| 5 | 10 | 26,468,598,849,608,400 | 0.007487 | 0.074869 |
| 6 | 3 | 89,077,015,359,259,200 | 0.025196 | 0.075589 |
| 7 | 1 | 224,342,112,756,653,000 | 0.063457 | 0.063457 |
| 8 | - | 429,655,207,020,554,000 | 0.121532 | 0.000000 |
| 9 | - | 632,136,396,535,987,000 | 0.178806 | 0.000000 |
| 10 | - | 718,528,370,729,238,000 | 0.203243 | 0.000000 |
| 11 | - | 632,136,396,535,987,000 | 0.178806 | 0.000000 |
| 12 | - | 429,655,207,020,554,000 | 0.121532 | 0.000000 |
| 13 | 1 | 224,342,112,756,653,000 | 0.063457 | 0.063457 |
| 14 | 3 | 89,077,015,359,259,200 | 0.025196 | 0.075589 |
| 15 | 10 | 26,468,598,849,608,400 | 0.007487 | 0.074869 |
| 16 | 40 | 5,744,053,569,793,500 | 0.001625 | 0.064991 |
| 17 | 200 | 876,675,902,544,001 | 0.000248 | 0.049595 |
| 18 | 1,000 | 88,436,604,204,000 | 0.000025 | 0.025015 |
| 19 | 5,000 | 5,251,296,336,000 | 0.000001 | 0.007427 |
| 20 | 12,500 | 137,846,528,820 | 0.000000 | 0.000487 |
| Total | 3,535,316,142,212,170,000 | 1.000000 | 0.722862 |
Edge
I saw a bet on the edge at the Plaza in Las Vegas on June 13, 2023. The ticket price was $3. The following table shows what each number of catches along the edge pay (based on a $3 bet), the probability, and return. The return is based on a $3 bet. The lower right cell shows an expected return of 71.38%.
Edge Analysis
| Catches | Pays ($3 bet) | Combinations | Probability | Return |
|---|---|---|---|---|
| 0 | 15000 | 16,735,679,449,896 | 0.000005 | 0.023669 |
| 1 | 1800 | 369,339,132,687,360 | 0.000104 | 0.062683 |
| 2 | 180 | 3,625,679,152,547,580 | 0.001026 | 0.061534 |
| 3 | 18 | 21,052,330,563,179,500 | 0.005955 | 0.035729 |
| 4 | 6 | 81,084,366,934,746,100 | 0.022936 | 0.045871 |
| 5 | 3 | 220,156,341,737,977,000 | 0.062273 | 0.062273 |
| 6 | 0 | 437,075,090,215,102,000 | 0.123631 | 0.000000 |
| 7 | 0 | 649,368,705,462,438,000 | 0.183681 | 0.000000 |
| 8 | 0 | 732,794,546,094,764,000 | 0.207278 | 0.000000 |
| 9 | 0 | 633,768,256,081,958,000 | 0.179268 | 0.000000 |
| 10 | 0 | 421,956,233,654,567,000 | 0.119355 | 0.000000 |
| 11 | 3 | 216,387,812,130,547,000 | 0.061207 | 0.061207 |
| 12 | 9 | 85,202,701,026,403,000 | 0.024100 | 0.072301 |
| 13 | 30 | 25,576,795,805,299,200 | 0.007235 | 0.072347 |
| 14 | 120 | 5,785,227,622,627,200 | 0.001636 | 0.065456 |
| 15 | 600 | 968,689,276,346,880 | 0.000274 | 0.054801 |
| 16 | 6000 | 116,958,222,286,200 | 0.000033 | 0.066166 |
| 17 | 30000 | 9,784,740,165,120 | 0.000003 | 0.027677 |
| 18 | 40000 | 531,779,356,800 | 0.000000 | 0.002006 |
| 19 | 75000 | 16,673,932,800 | 0.000000 | 0.000118 |
| 20 | 100000 | 225,792,840 | 0.000000 | 0.000002 |
| Total | 3,535,316,142,212,170,000 | 1.000000 | 0.713840 |