Wizard Recommends
-
 $11000 Welcome Bonus
 -
 $3000 Welcome Bonus
 -
 UP TO $777 BONUS
On this page
Thunder Power
Introduction
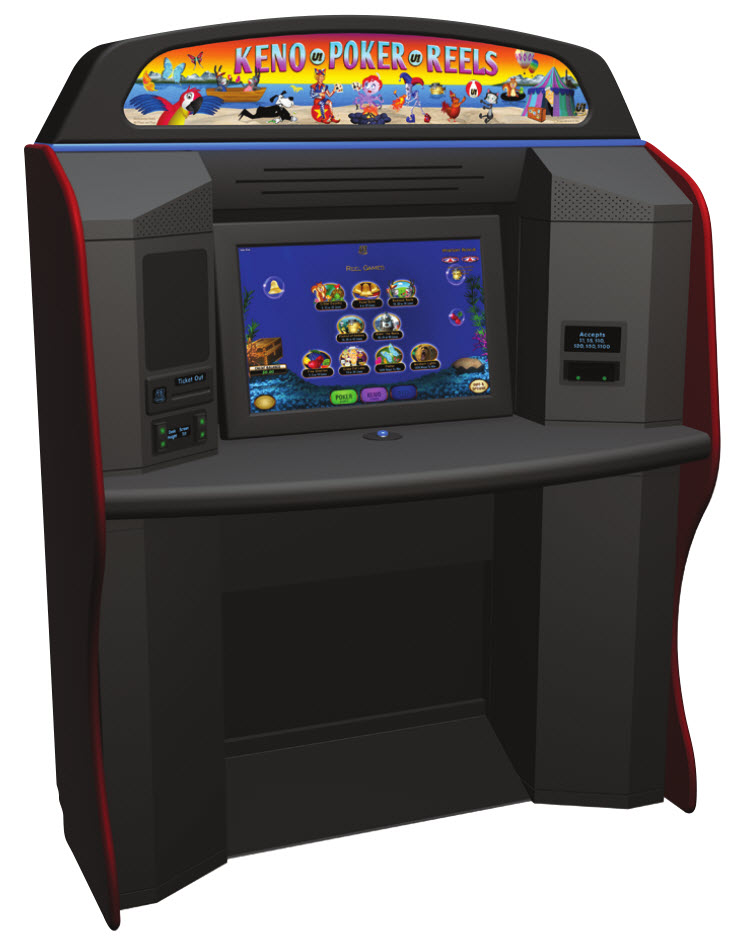
Thunder Power is a keno-based game found on multi-game machines made by U1 Gaming. I have seen such machines at the Las Vegas Club, Rampart, El Cortez and Dotty's casinos in Las Vegas. The thrust of Thunder Power is the game draws different color balls, and dependent on the number of catches of each color and the mixture of colors, there are four different ways to win.
Rules
- The player chooses 2 to 10 numbers from a range of 1 to 80.
- The game will choose 20 balls from the 1 to 80 range.
- Of the 20 balls the game draws, ten are green, six are blue, and four are red.
- The player has four ways to win, as follows:
- Total picks that match the green balls.
- Total picks that match the blue balls.
- Total picks that match the red balls.
- Total picks that match a mixed combination of balls.
- For wins based on a mixed combination, at least two colors must be represented.
- Multipliers are available based on the 20th ball drawn, as follows:
- If the 20th ball drawn is green and matches a player pick, then the player will win a 3x multiplier on all wins based on total green balls and total mixed balls.
- If the 20th ball drawn is blue and matches a player pick, then the player will win a 4x multiplier on all wins based on total blue balls and total mixed balls.
- If the 20th ball drawn is red and matches a player pick, then the player will win a 7x multiplier on all wins based on total red balls and total mixed balls.
- The color of the 20th ball drawn is determined randomly, with the probability of each color proportional to the total number of balls of that color.
As with all games by U1 Gaming, there is also a randomly-triggered bonus game, that adds 0.5025% to the return.
Pay Tables
The following pay tables are for bets of $2. Generally speaking with U1 games, the more you bet, the more generous the pay table is.
Pay Table for Mixed Colored Wins
| Hit | Pick | ||||||||
|---|---|---|---|---|---|---|---|---|---|
| 10 | 9 | 8 | 7 | 6 | 5 | 4 | 3 | 2 | |
| 10 | 3000 | ||||||||
| 9 | 1000 | 3000 | |||||||
| 8 | 160 | 800 | 3000 | ||||||
| 7 | 20 | 75 | 289 | 1100 | |||||
| 6 | 4 | 10 | 40 | 50 | 450 | ||||
| 5 | 2 | 2 | 4 | 6 | 30 | 188 | |||
| 4 | 1 | 1 | 1 | 2 | 3 | 10 | 50 | ||
| 3 | 0 | 0 | 0 | 1 | 1 | 1 | 2 | 16 | |
| 2 | 0 | 0 | 0 | 0 | 0 | 0 | 1 | 1 | 5 |
| 1 | 0 | 0 | 0 | 0 | 0 | 0 | 0 | 0 | 0 |
| 0 | 0 | 0 | 0 | 0 | 0 | 0 | 0 | 0 | 0 |
Pay Table for Green Wins
| Hit | Pick | ||||||||
|---|---|---|---|---|---|---|---|---|---|
| 10 | 9 | 8 | 7 | 6 | 5 | 4 | 3 | 2 | |
| 10 | 8000 | ||||||||
| 9 | 3000 | 8000 | |||||||
| 8 | 1000 | 3000 | 8000 | ||||||
| 7 | 400 | 500 | 3000 | 7000 | |||||
| 6 | 60 | 100 | 443 | 700 | 2000 | ||||
| 5 | 10 | 8 | 40 | 50 | 270 | 400 | |||
| 4 | 2 | 2 | 4 | 5 | 20 | 20 | 100 | ||
| 3 | 0 | 1 | 1 | 2 | 2 | 3 | 4 | 32 | |
| 2 | 0 | 0 | 0 | 0 | 0 | 1 | 2 | 2 | 10 |
| 1 | 0 | 0 | 0 | 0 | 0 | 0 | 0 | 0 | 0 |
| 0 | 0 | 0 | 0 | 0 | 0 | 0 | 0 | 0 | 0 |
Pay Table for Blue Wins
| Hit | Pick | ||||||||
|---|---|---|---|---|---|---|---|---|---|
| 10 | 9 | 8 | 7 | 6 | 5 | 4 | 3 | 2 | |
| 6 | 2000 | 2000 | 3000 | 5000 | 6000 | ||||
| 5 | 120 | 344 | 400 | 500 | 599.5 | 4000 | |||
| 4 | 10 | 26 | 40 | 70 | 50 | 120 | 400 | ||
| 3 | 1 | 2 | 4 | 6 | 6 | 8 | 10 | 132 | |
| 2 | 0 | 0 | 0 | 0 | 1 | 2 | 3 | 4 | 20 |
| 1 | 0 | 0 | 0 | 0 | 0 | 0 | 0 | 0 | 1 |
| 0 | 0 | 0 | 0 | 0 | 0 | 0 | 0 | 0 | 0 |
Pay Table for Red Wins
| Hit | Pick | ||||||||
|---|---|---|---|---|---|---|---|---|---|
| 10 | 9 | 8 | 7 | 6 | 5 | 4 | 3 | 2 | |
| 4 | 100 | 200 | 300 | 500 | 599.5 | 1000 | 1200 | ||
| 3 | 3 | 4 | 8 | 12 | 20 | 27.5 | 62 | 325 | |
| 2 | 1 | 1 | 1 | 1 | 2 | 3 | 4 | 8 | 38.5 |
| 1 | 0 | 0 | 0 | 0 | 0 | 0 | 0 | 1 | 1 |
Examples
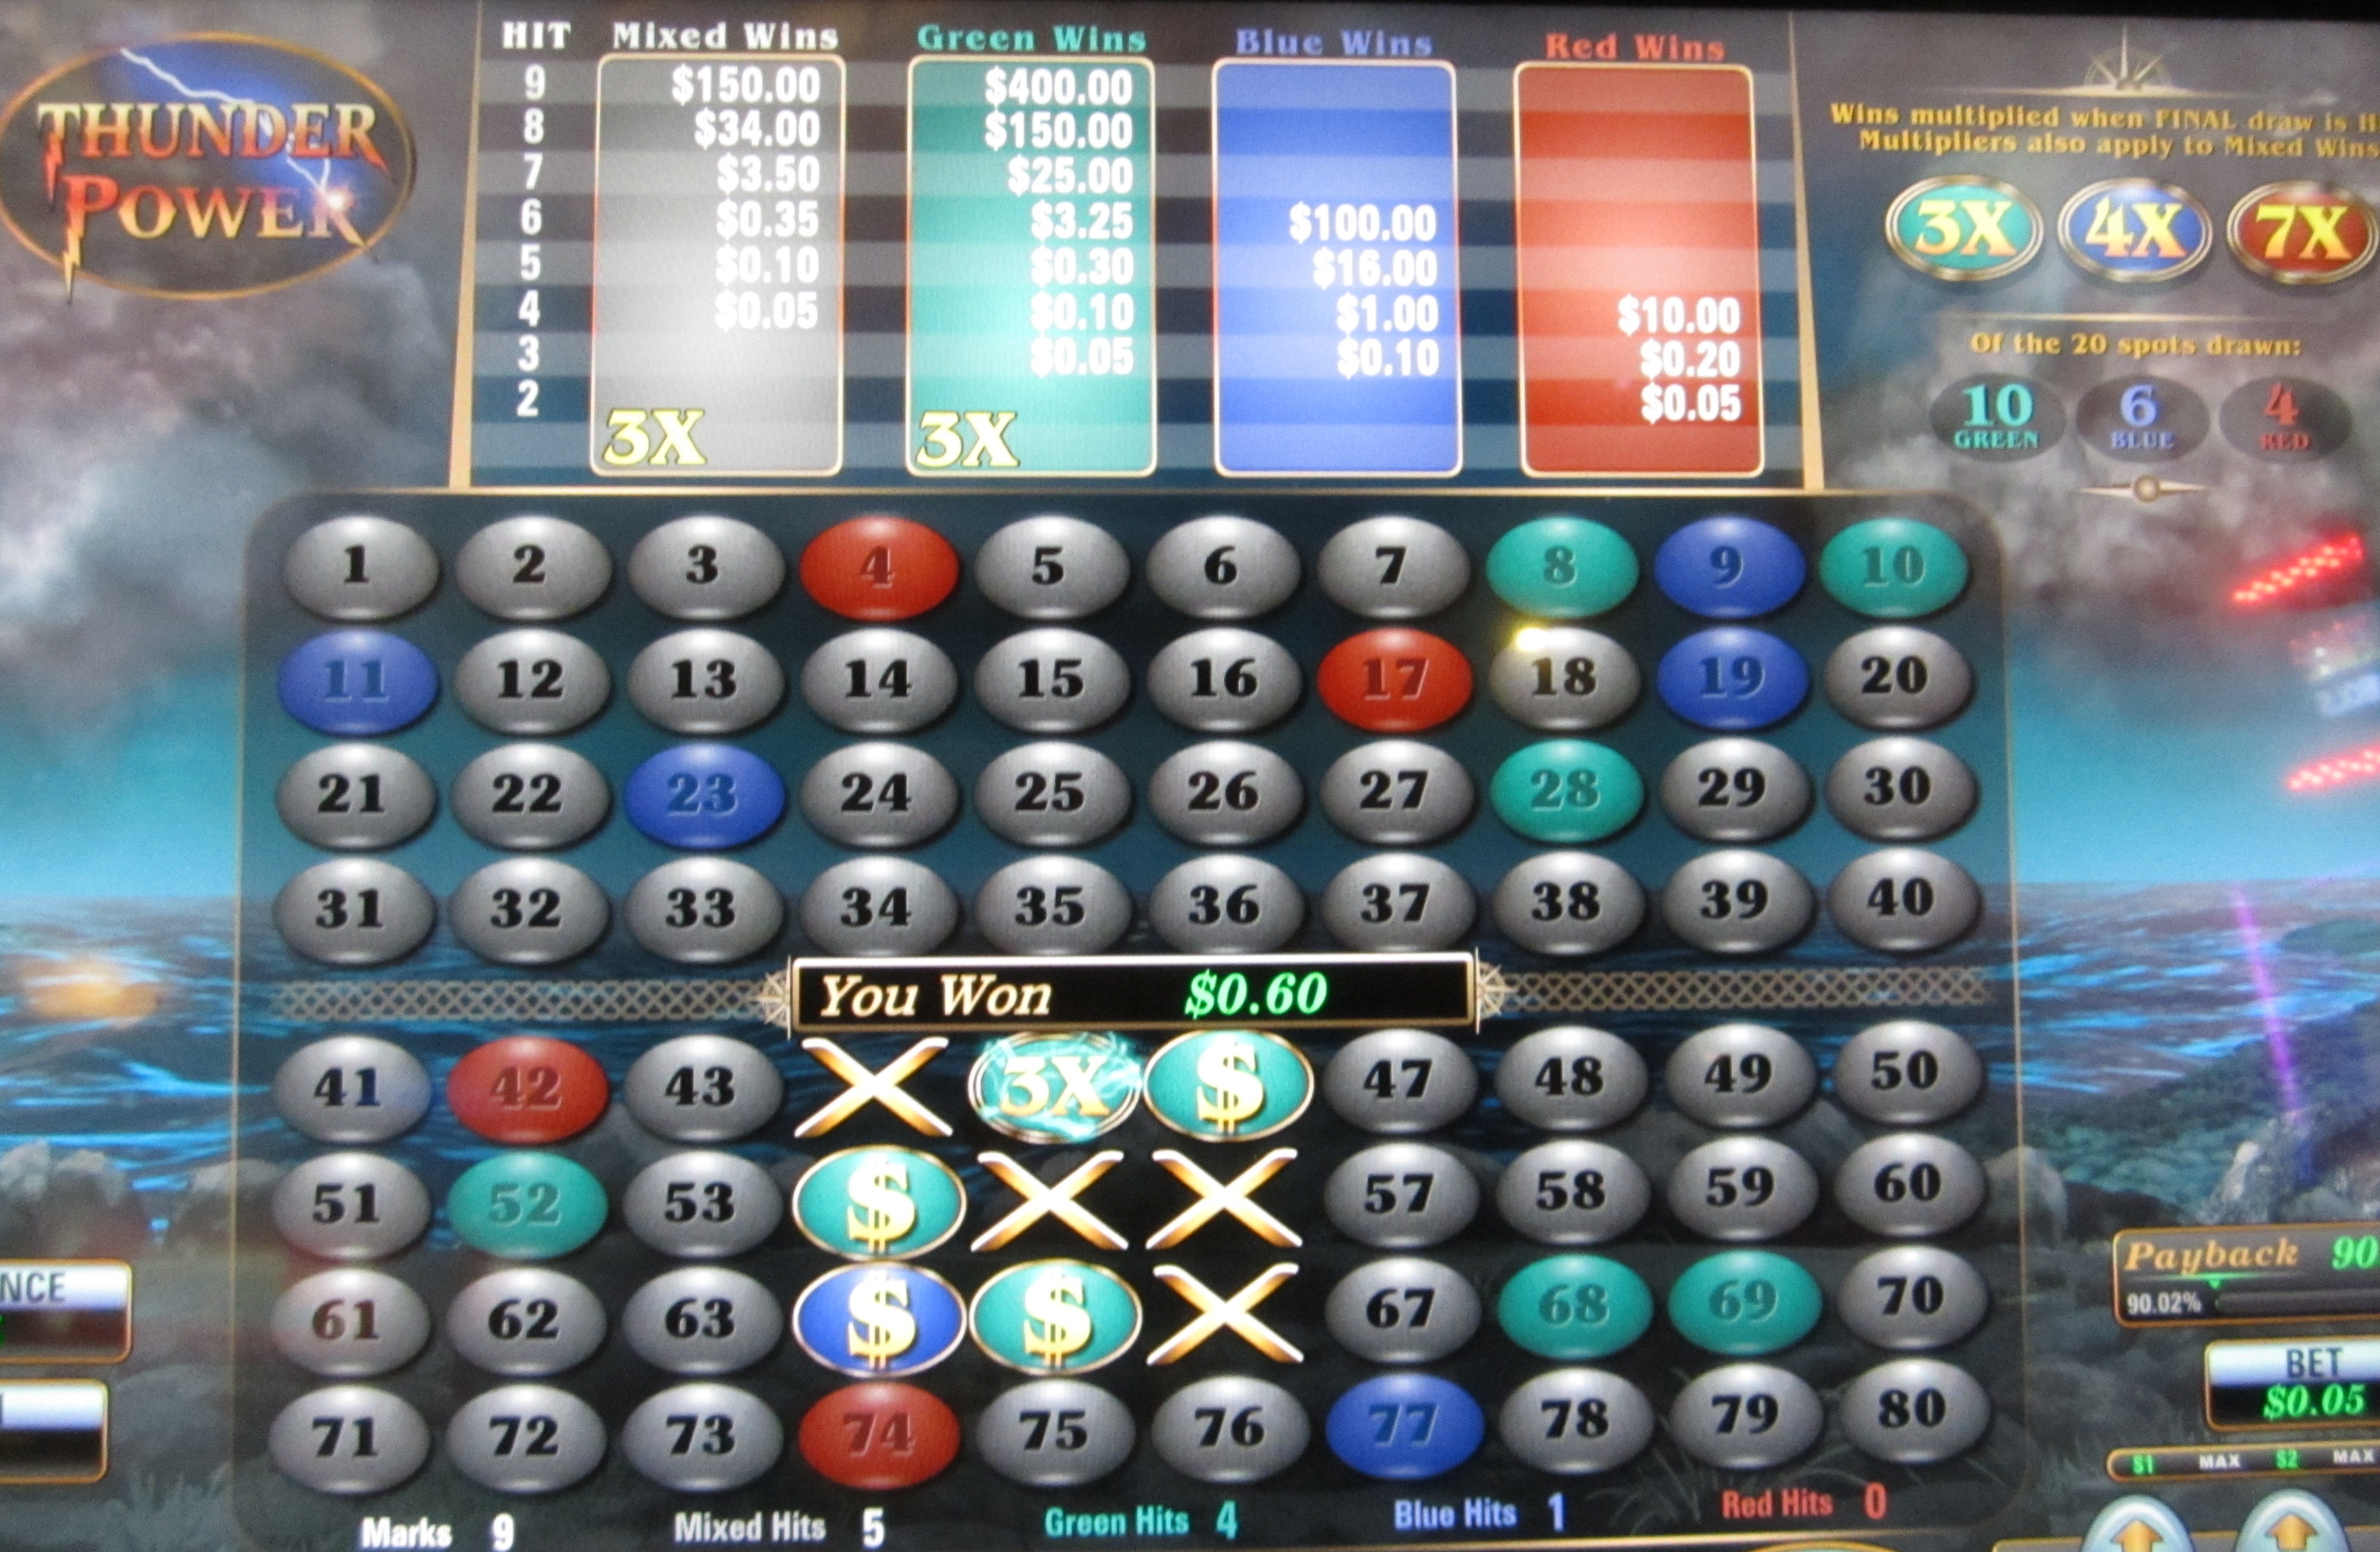
In the example above, I caught four green balls and one red ball. I won 10¢ for five mixed catches and 10¢ for four green catches, for a total win of 20¢.
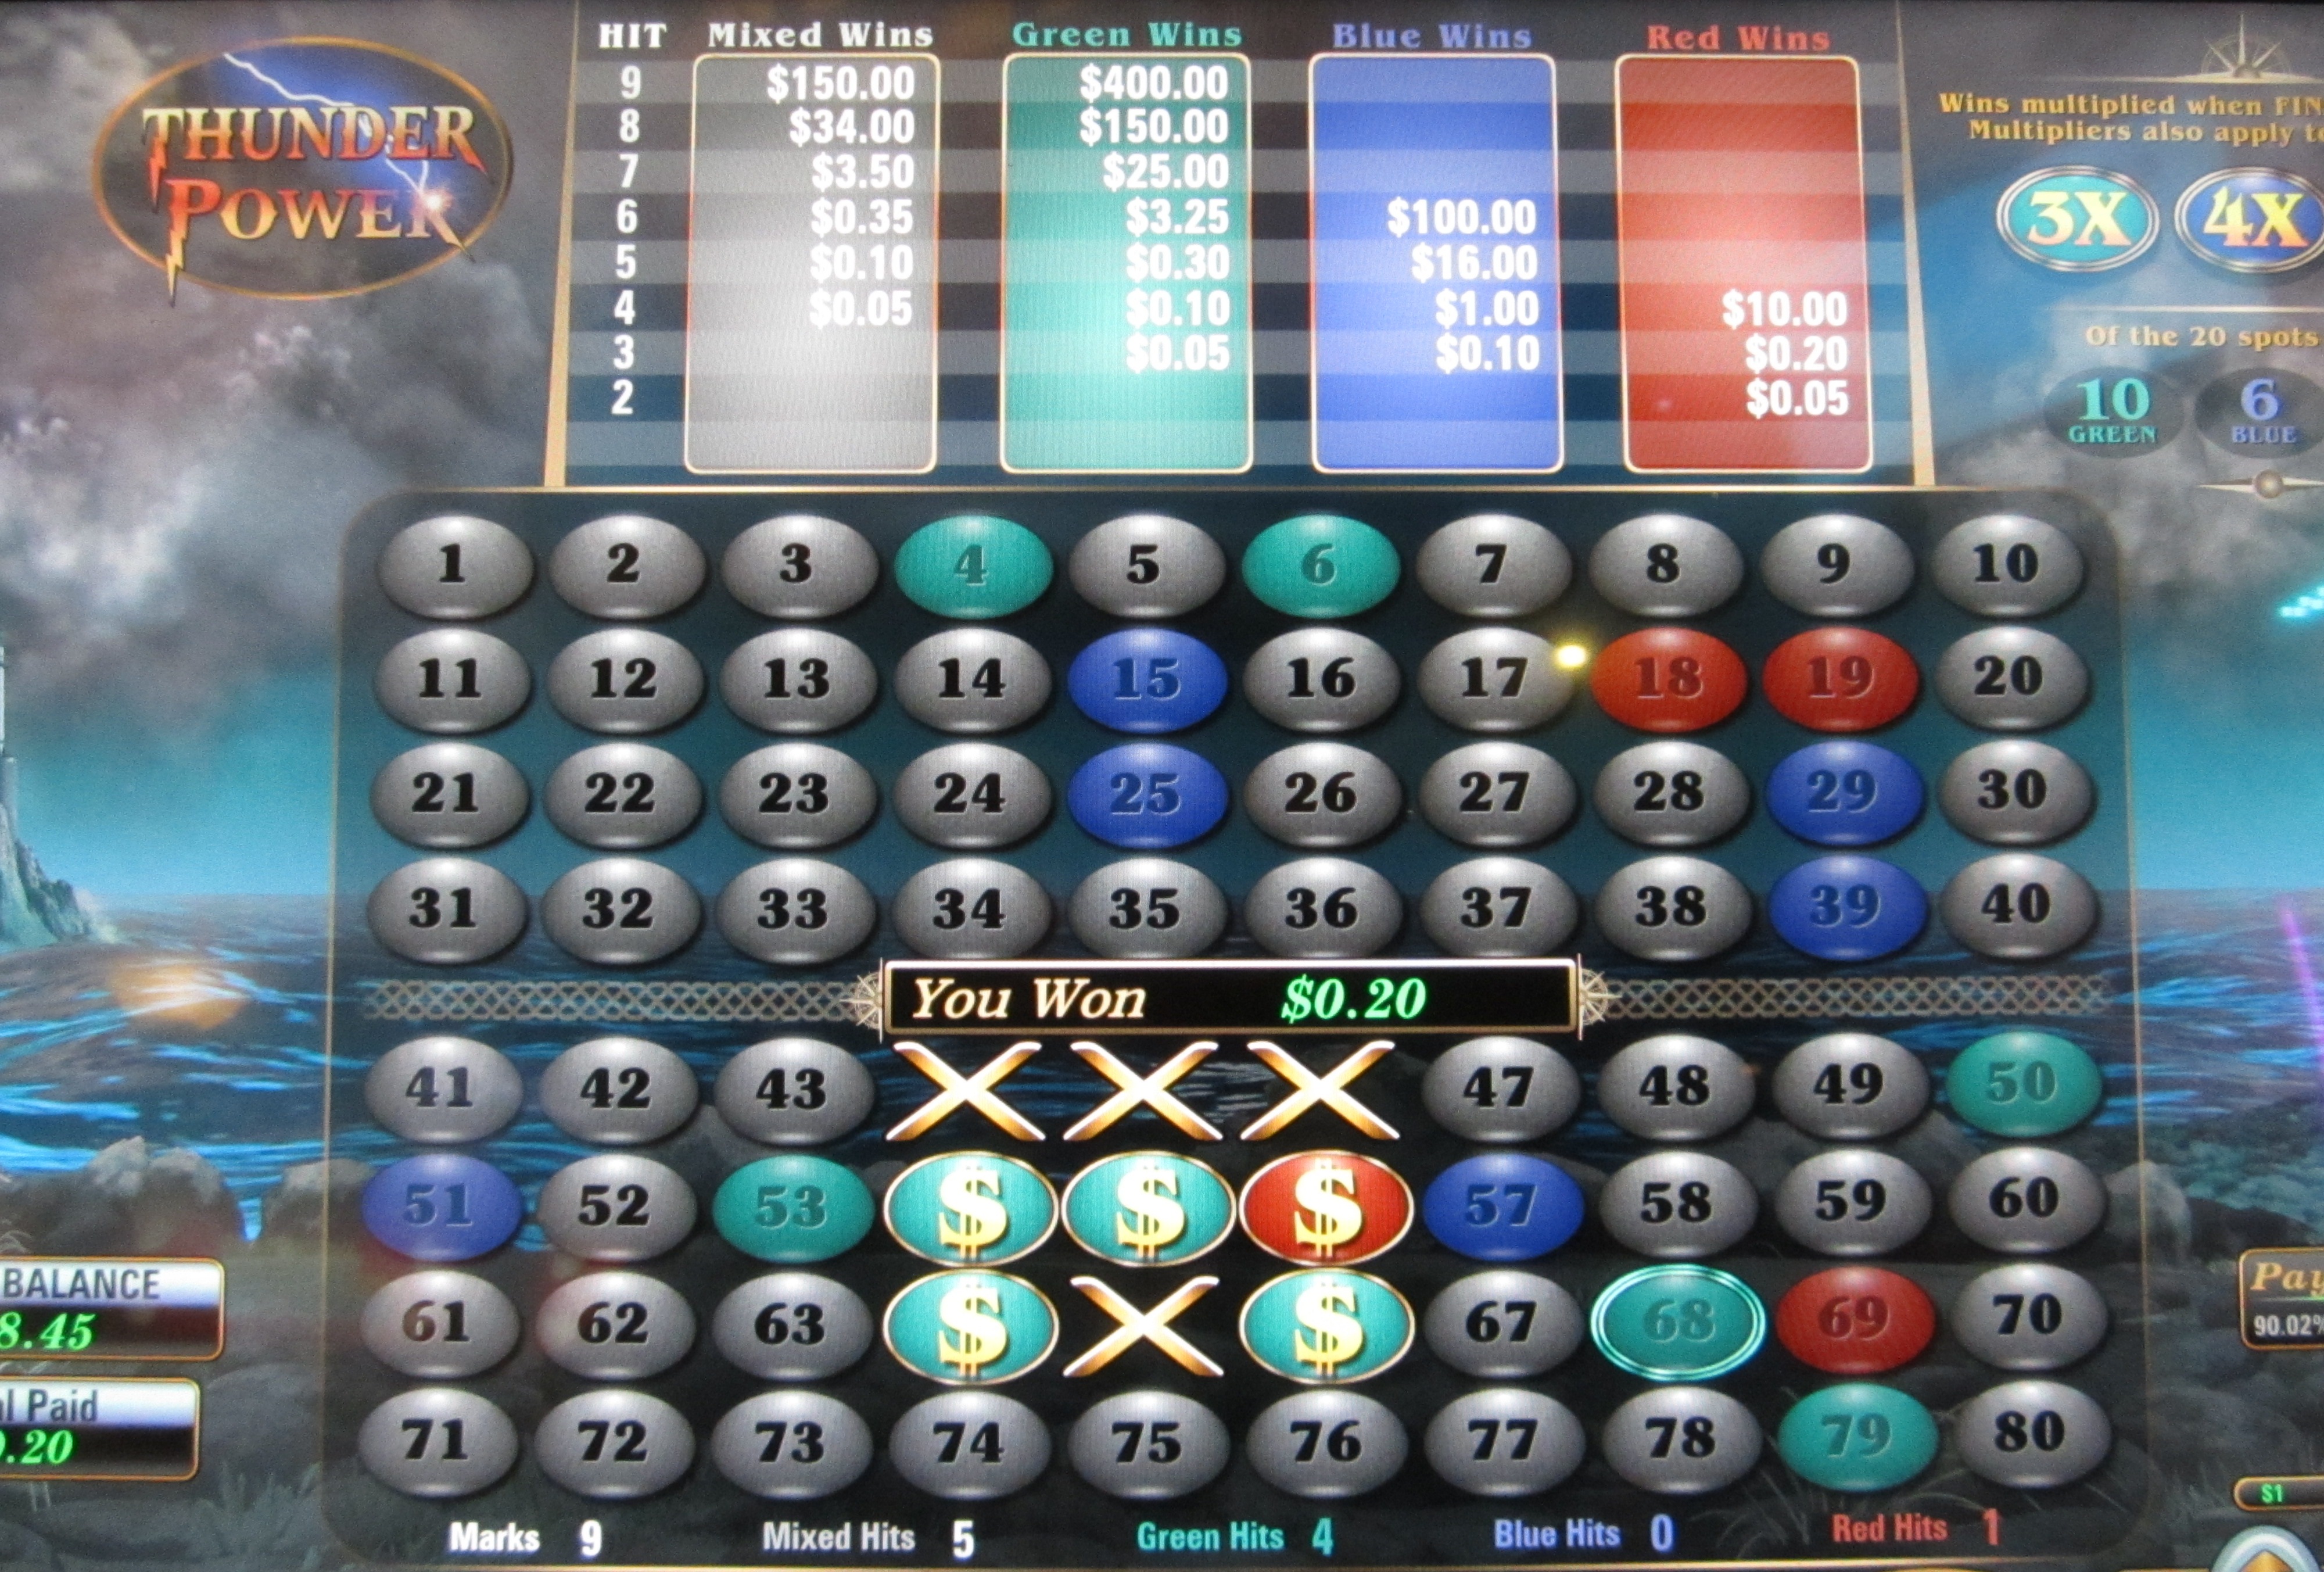
In the example above, I caught one green ball, one blue ball, and two red balls. The 20th number drawn was a red catch, so I won a 7x multiplier on mixed and red wins. Before considering the multiplier, four mixed catches would pay 5¢ and two red wins would also pay 5¢. Considering the multiplier, both wins are multiplied by seven, for a total win of 7×(5¢ + 5¢) = 70¢.
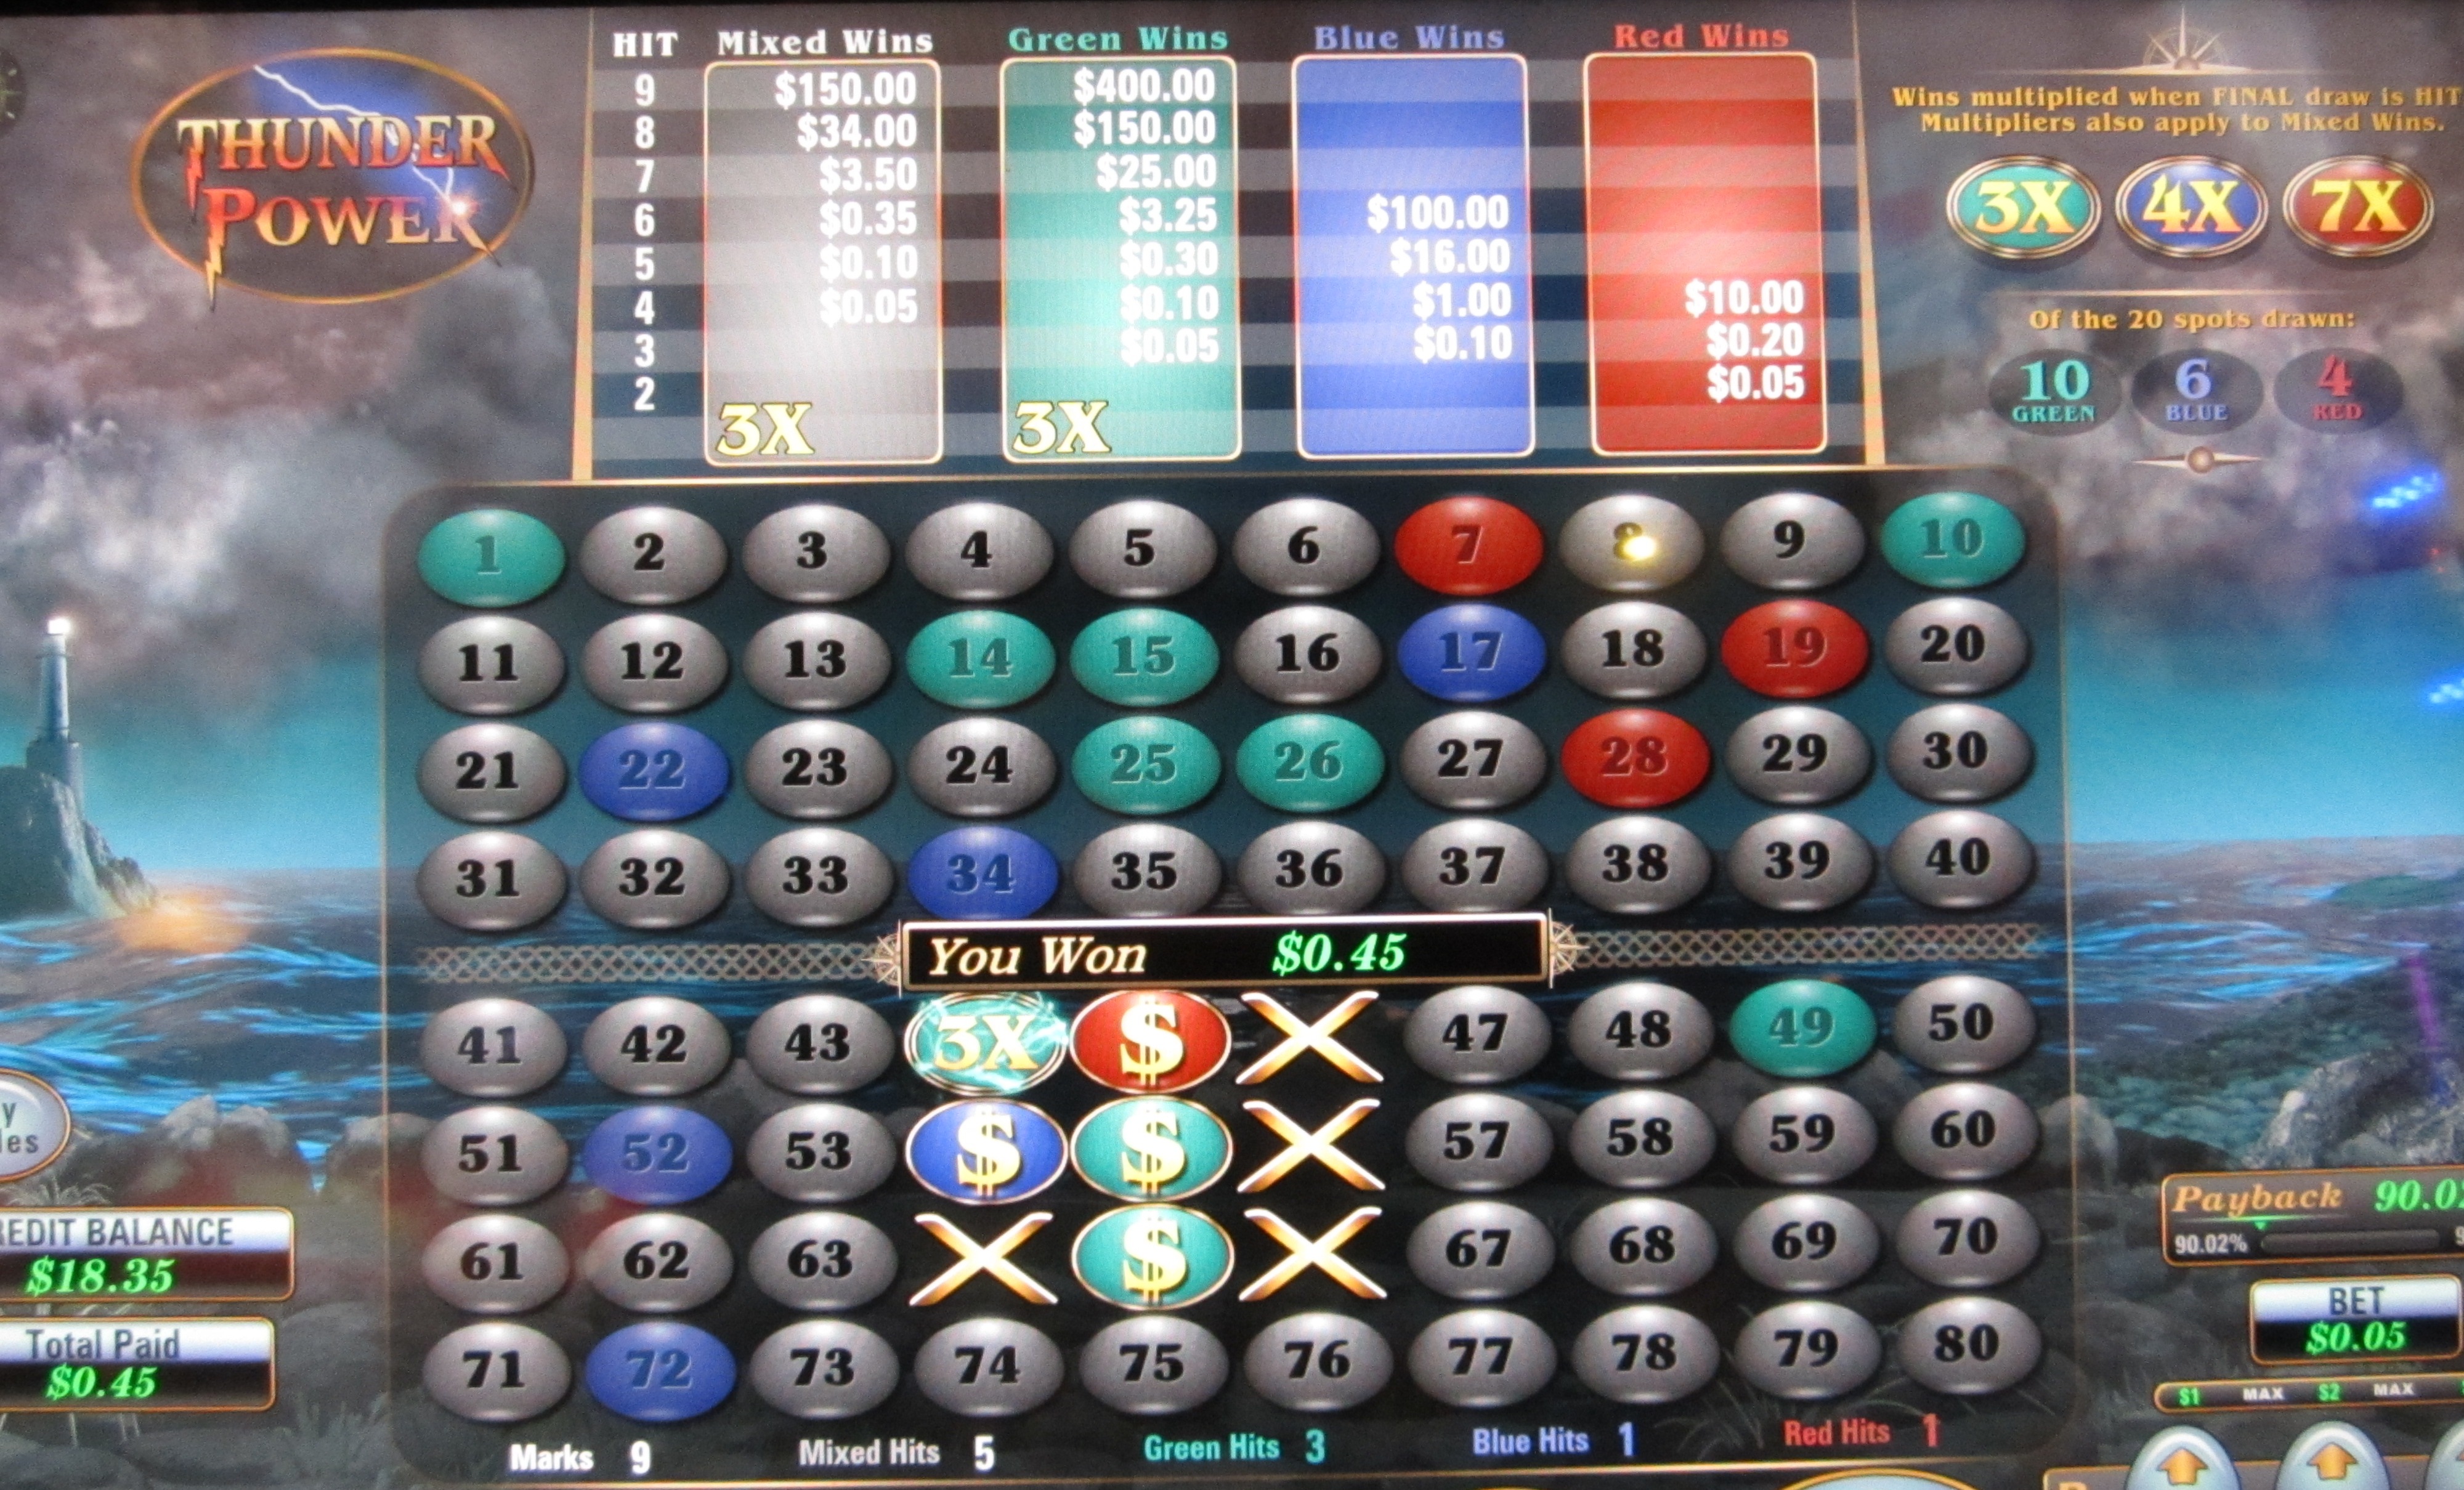
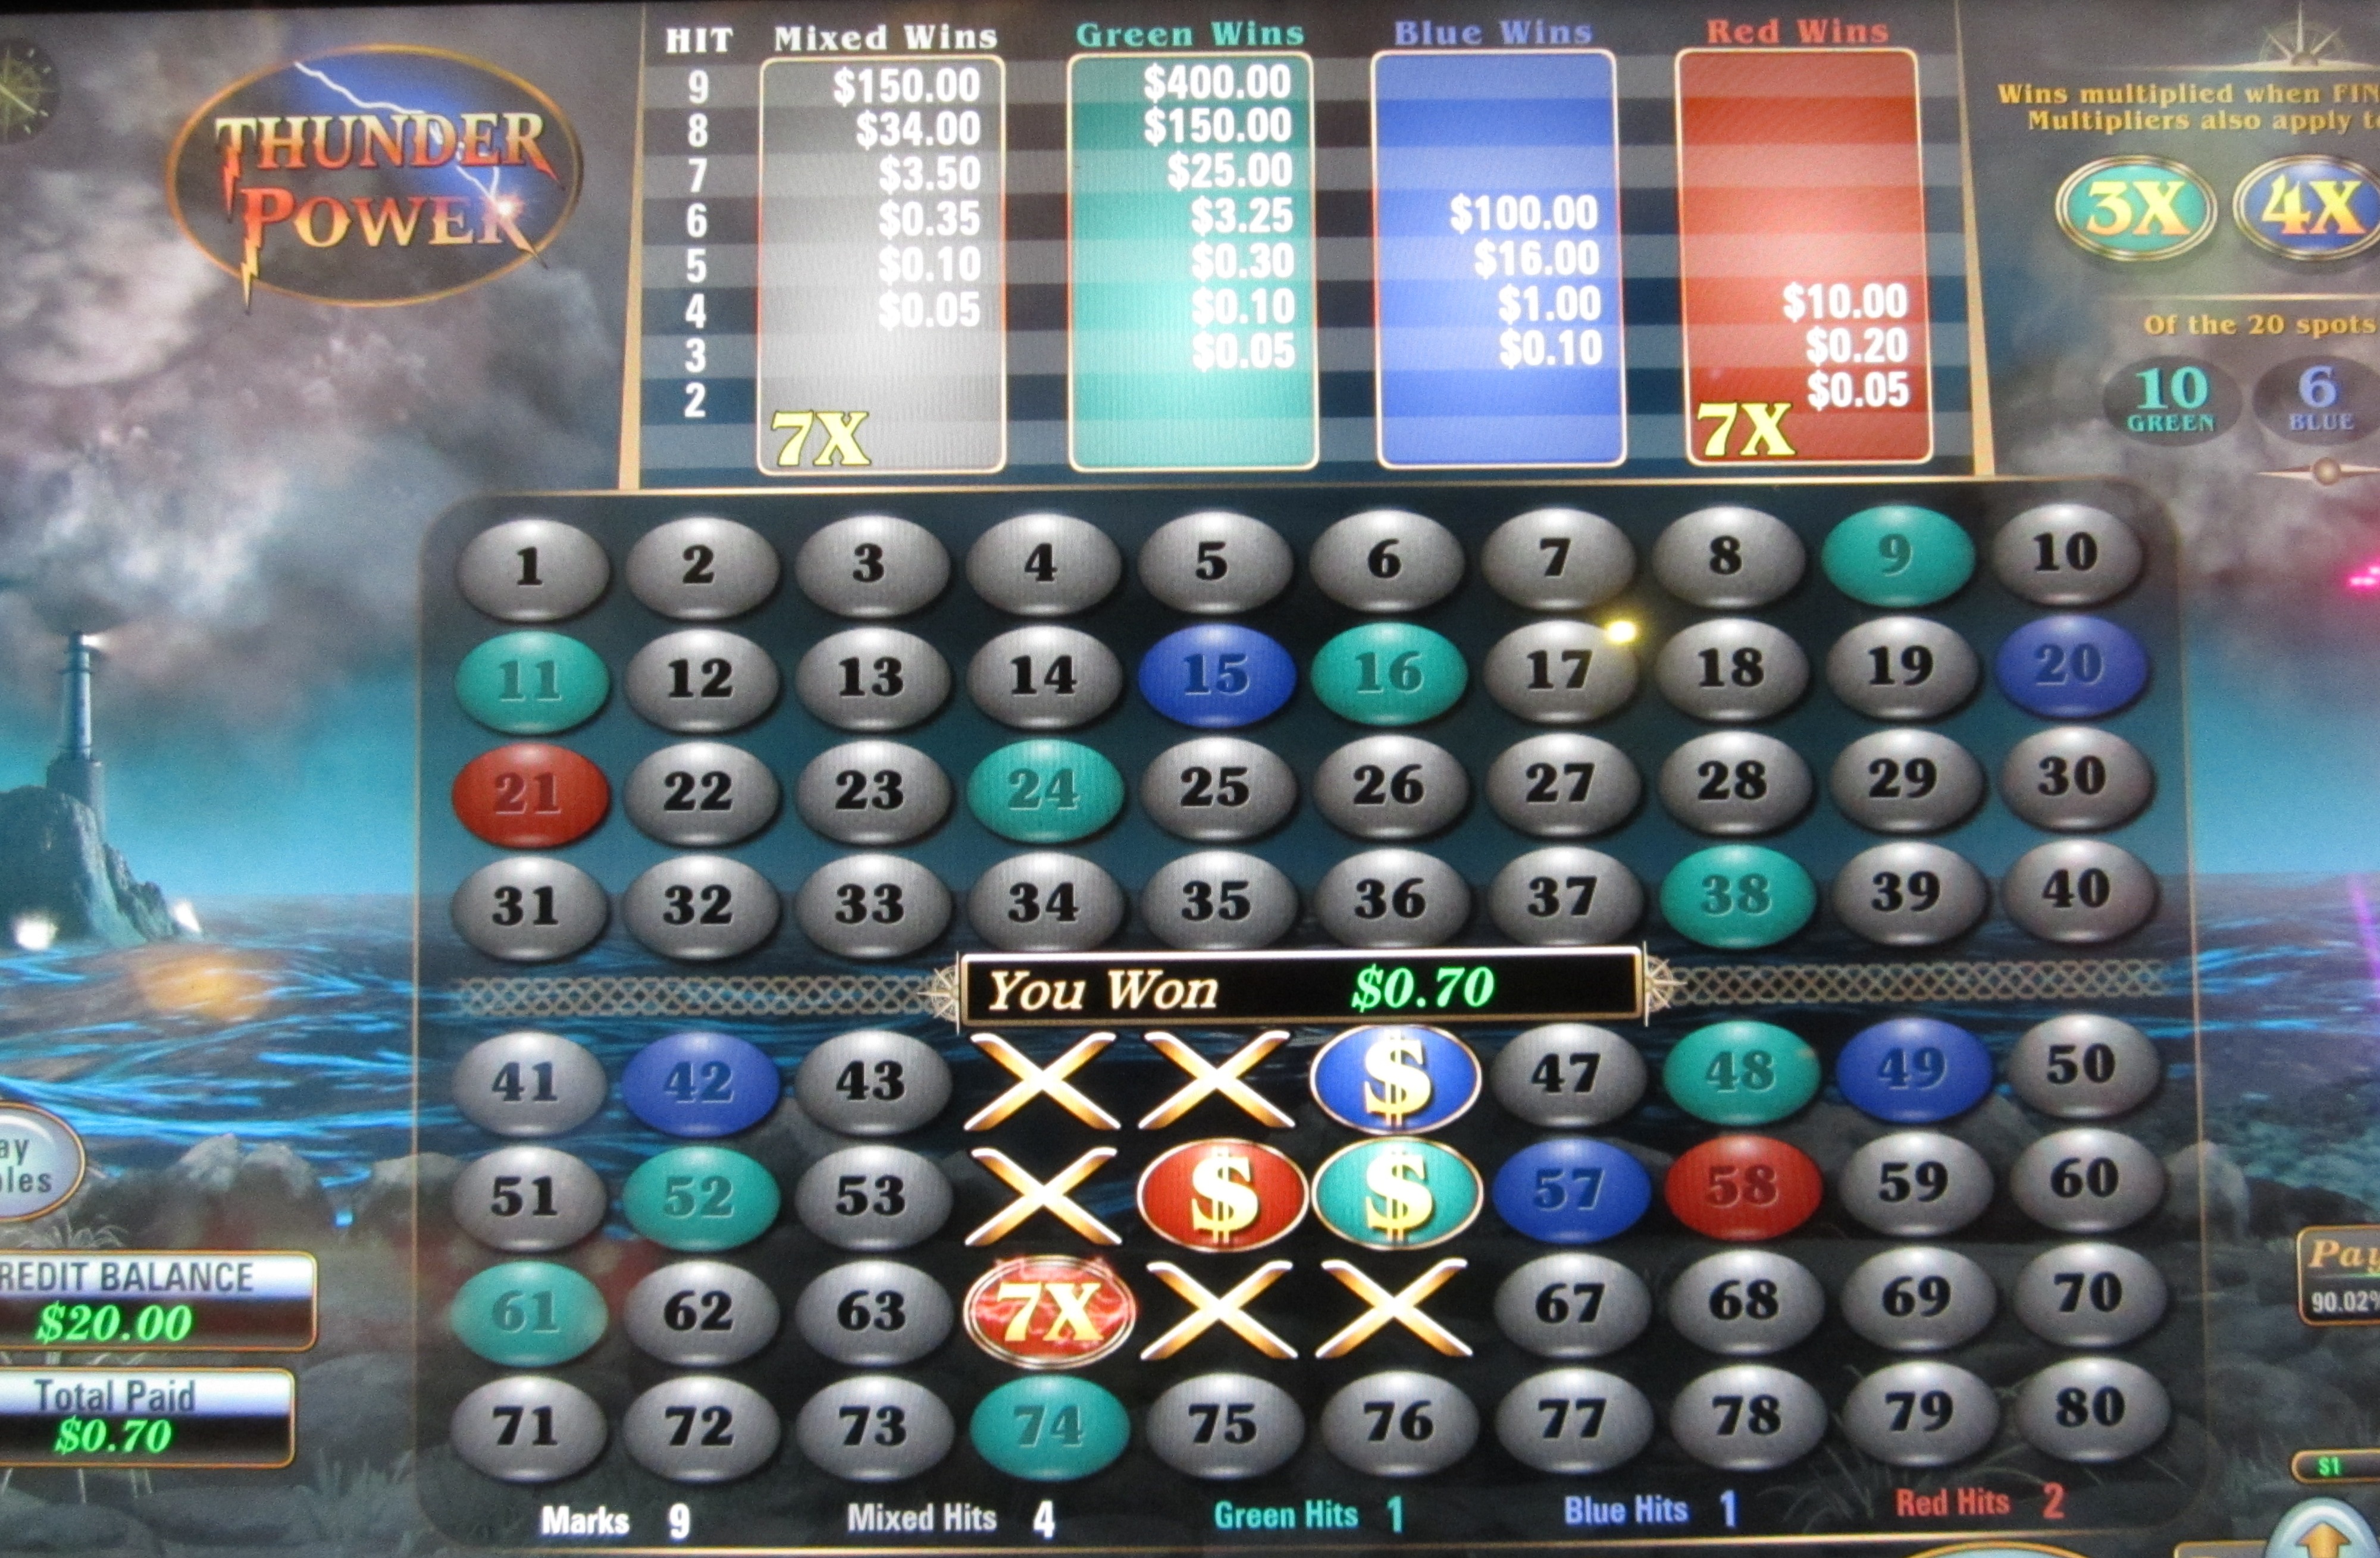
In the example above, I caught three green balls, one blue ball, and one red ball. The 20th number drawn was a green catch, so I won a 3x multiplier on mixed and green wins. Before considering the multiplier, five mixed catches would pay 10¢ and three green wins would also pay 5¢. Considering the multiplier, both wins are multiplied by three, for a total win of 3×(10¢ + 5¢) = 45¢.
Odds
Following are the expected multipliers for each type of win:
- Mixed colors: 1+0.155×m, where m is the number of mixed wins.
- Green: 1+0.1×m, where m is the number of green wins.
- Blue: 1+0.15×m, where m is the number of blue wins.
- Red: 1+0.3×m, where m is the number of red wins.
The following table shows the expected return for mixed wins. If you're trying to reproduce this table yourself, I would first calculate the total return regardless of the mixture of balls, and then subtract out the value of wins of all one color.
Return for Mixed Wins
| Hit | Pick | ||||||||
|---|---|---|---|---|---|---|---|---|---|
| 10 | 9 | 8 | 7 | 6 | 5 | 4 | 3 | 2 | |
| 10 | 0.000858 | ||||||||
| 9 | 0.014658 | 0.005204 | |||||||
| 8 | 0.048520 | 0.058389 | 0.029194 | ||||||
| 7 | 0.067100 | 0.092407 | 0.096563 | 0.055897 | |||||
| 6 | 0.088221 | 0.109889 | 0.181885 | 0.070326 | 0.111517 | ||||
| 5 | 0.179991 | 0.114101 | 0.128114 | 0.090701 | 0.162516 | 0.212173 | |||
| 4 | 0.228920 | 0.177309 | 0.126650 | 0.162200 | 0.133036 | 0.187904 | 0.238012 | ||
| 3 | 0.000000 | 0.000000 | 0.000000 | 0.226800 | 0.168253 | 0.108784 | 0.112103 | 0.287731 | |
| 2 | 0.000000 | 0.000000 | 0.000000 | 0.000000 | 0.000000 | 0.000000 | 0.185552 | 0.121081 | 0.262342 |
| 1 | 0.000000 | 0.000000 | 0.000000 | 0.000000 | 0.000000 | 0.000000 | 0.000000 | 0.000000 | 0.000000 |
| 0 | 0.000000 | 0.000000 | 0.000000 | 0.000000 | 0.000000 | 0.000000 | 0.000000 | 0.000000 | 0.000000 |
| Total | 0.628269 | 0.557299 | 0.562405 | 0.605925 | 0.575322 | 0.508862 | 0.535667 | 0.408812 | 0.262342 |
Return for Green Wins
| Hit | Pick | ||||||||
|---|---|---|---|---|---|---|---|---|---|
| 10 | 9 | 8 | 7 | 6 | 5 | 4 | 3 | 2 | |
| 10 | 0.000000 | ||||||||
| 9 | 0.000002 | 0.000001 | |||||||
| 8 | 0.000119 | 0.000073 | 0.000022 | ||||||
| 7 | 0.002713 | 0.001062 | 0.001478 | 0.000450 | |||||
| 6 | 0.011227 | 0.007931 | 0.012401 | 0.005183 | 0.002236 | ||||
| 5 | 0.027786 | 0.011956 | 0.028553 | 0.014368 | 0.023774 | 0.006290 | |||
| 4 | 0.046825 | 0.030688 | 0.037198 | 0.025330 | 0.047255 | 0.017121 | 0.018589 | ||
| 3 | 0.000000 | 0.088202 | 0.065134 | 0.090052 | 0.056835 | 0.047014 | 0.027618 | 0.060759 | |
| 2 | 0.000000 | 0.000000 | 0.000000 | 0.000000 | 0.000000 | 0.122960 | 0.164911 | 0.092016 | 0.170886 |
| 1 | 0.000000 | 0.000000 | 0.000000 | 0.000000 | 0.000000 | 0.000000 | 0.000000 | 0.000000 | 0.000000 |
| 0 | 0.000000 | 0.000000 | 0.000000 | 0.000000 | 0.000000 | 0.000000 | 0.000000 | 0.000000 | 0.000000 |
| Total | 0.088671 | 0.139914 | 0.144785 | 0.135383 | 0.130101 | 0.193385 | 0.211118 | 0.152775 | 0.170886 |
Return for Blue Wins
| Hit | Pick | ||||||||
|---|---|---|---|---|---|---|---|---|---|
| 10 | 9 | 8 | 7 | 6 | 5 | 4 | 3 | 2 | |
| 6 | 0.002656 | 0.001062 | 0.000531 | 0.000221 | 0.000038 | ||||
| 5 | 0.012327 | 0.017922 | 0.009392 | 0.004464 | 0.001550 | 0.001747 | |||
| 4 | 0.027003 | 0.043346 | 0.038106 | 0.034282 | 0.010786 | 0.008865 | 0.006070 | ||
| 3 | 0.031696 | 0.046333 | 0.064463 | 0.063024 | 0.037535 | 0.026066 | 0.013569 | 0.046592 | |
| 2 | 0.000000 | 0.000000 | 0.000000 | 0.000000 | 0.074666 | 0.105164 | 0.099905 | 0.070253 | 0.123418 |
| 1 | 0.000000 | 0.000000 | 0.000000 | 0.000000 | 0.000000 | 0.000000 | 0.000000 | 0.000000 | 0.161582 |
| 0 | 0.000000 | 0.000000 | 0.000000 | 0.000000 | 0.000000 | 0.000000 | 0.000000 | 0.000000 | 0.000000 |
| Total | 0.073682 | 0.108662 | 0.112492 | 0.101991 | 0.124576 | 0.141842 | 0.119544 | 0.116845 | 0.285000 |
Return for Red Wins
| Hit | Pick | ||||||||
|---|---|---|---|---|---|---|---|---|---|
| 10 | 9 | 8 | 7 | 6 | 5 | 4 | 3 | 2 | |
| 4 | 0.029211 | 0.035054 | 0.029211 | 0.024343 | 0.012509 | 0.006955 | 0.001669 | ||
| 3 | 0.030274 | 0.028659 | 0.038750 | 0.036833 | 0.035559 | 0.024777 | 0.022643 | 0.030063 | |
| 2 | 0.109941 | 0.090502 | 0.072402 | 0.055831 | 0.081974 | 0.084220 | 0.069197 | 0.071042 | 0.116962 |
| 1 | 0.000000 | 0.000000 | 0.000000 | 0.000000 | 0.000000 | 0.000000 | 0.000000 | 0.180380 | 0.125063 |
| 0 | 0.000000 | 0.000000 | 0.000000 | 0.000000 | 0.000000 | 0.000000 | 0.000000 | 0.000000 | 0.000000 |
| Total | 0.169426 | 0.154214 | 0.140363 | 0.117006 | 0.130042 | 0.115952 | 0.093509 | 0.281485 | 0.242025 |
The following table shows the contribution to the return of each type of win, including the random bonus. The right column shows the total return for each number of picks.
Total Return Table
| Pick | Mixed | Green | Blue | Red | Random | Total |
|---|---|---|---|---|---|---|
| 2 | 0.262342 | 0.170886 | 0.285000 | 0.242025 | 0.005025 | 0.965278 |
| 3 | 0.408812 | 0.152775 | 0.116845 | 0.281485 | 0.005025 | 0.964942 |
| 4 | 0.535667 | 0.211118 | 0.119544 | 0.093509 | 0.005025 | 0.964863 |
| 5 | 0.508862 | 0.193385 | 0.141842 | 0.115952 | 0.005025 | 0.965066 |
| 6 | 0.575322 | 0.130101 | 0.124576 | 0.130042 | 0.005025 | 0.965065 |
| 7 | 0.605925 | 0.135383 | 0.101991 | 0.117006 | 0.005025 | 0.965331 |
| 8 | 0.562405 | 0.144785 | 0.112492 | 0.140363 | 0.005025 | 0.965071 |
| 9 | 0.557299 | 0.139914 | 0.108662 | 0.154214 | 0.005025 | 0.965115 |
| 10 | 0.628269 | 0.088671 | 0.073682 | 0.169426 | 0.005025 | 0.965073 |