Wizard Recommends
-
 $11000 Welcome Bonus
 -
 $3000 Welcome Bonus
 -
 UP TO $777 BONUS
Ask The Wizard #284
Did you hear about the car dealership in Seattle that had to pay $420,000 because the Seahawks shutout the Giants? I read they had to pay $7,000 for the insurance policy against that. What would have been a fair premium?
According to the article Washington car dealership paying out $420,000 after Seahawks shutout, the dealership ran a promotion to pay twelve winners $35,000 each if the Seahawks shut out the Giants in the week 15 game, played on December 15, 2013. The article goes onto say that the dealership paid $7,000 for an insurance policy to pay in said event in case it actually happened.
Based on every NFL game from the 1983 to 2012 seasons, a specific side of any given game was shut out. However, as a seven-point underdog, in a game with an average over/under, I would argue the probability of the Giants being shutout were higher than average. The over/under in that game was 41. Let's do a little algebra to solve for the expected number of Giants points.
Let:
s=Seahawks points
g=Giants points
We know that s+g=41 and s=g+7, based on the point spread and over/under total.
Substituting the second equation into the first:
(g+7) + g = 41
2g +7 = 41
2g = 34
g = 17
Next, let's look at the probability of a shutout by the estimated number of points of each team, based on the 1983 to 2012 seasons. I skipped any rows where the sample size was zero.
Probability of Shutout
| Estimated Points |
Sample Size | Shutouts | Ratio |
|---|---|---|---|
| 5.25 | 1 | 0 | 0.0% |
| 6.50 | 1 | 0 | 0.0% |
| 7.75 | 1 | 0 | 0.0% |
| 8.00 | 1 | 0 | 0.0% |
| 8.25 | 3 | 0 | 0.0% |
| 8.50 | 2 | 0 | 0.0% |
| 8.75 | 2 | 0 | 0.0% |
| 9.00 | 2 | 0 | 0.0% |
| 9.50 | 4 | 0 | 0.0% |
| 9.75 | 6 | 1 | 16.7% |
| 10.00 | 10 | 1 | 10.0% |
| 10.25 | 7 | 0 | 0.0% |
| 10.50 | 14 | 2 | 14.3% |
| 10.75 | 7 | 1 | 14.3% |
| 11.00 | 13 | 1 | 7.7% |
| 11.25 | 21 | 1 | 4.8% |
| 11.50 | 22 | 3 | 13.6% |
| 11.75 | 23 | 1 | 4.3% |
| 12.00 | 34 | 2 | 5.9% |
| 12.25 | 36 | 7 | 19.4% |
| 12.50 | 41 | 3 | 7.3% |
| 12.75 | 39 | 4 | 10.3% |
| 13.00 | 55 | 1 | 1.8% |
| 13.25 | 58 | 5 | 8.6% |
| 13.50 | 78 | 1 | 1.3% |
| 13.75 | 89 | 5 | 5.6% |
| 14.00 | 92 | 4 | 4.3% |
| 14.25 | 108 | 7 | 6.5% |
| 14.50 | 117 | 8 | 6.8% |
| 14.75 | 141 | 7 | 5.0% |
| 15.00 | 160 | 7 | 4.4% |
| 15.25 | 160 | 7 | 4.4% |
| 15.50 | 213 | 7 | 3.3% |
| 15.75 | 198 | 11 | 5.6% |
| 16.00 | 206 | 6 | 2.9% |
| 16.25 | 221 | 12 | 5.4% |
| 16.50 | 241 | 10 | 4.1% |
| 16.75 | 273 | 7 | 2.6% |
| 17.00 | 306 | 8 | 2.6% |
| 17.25 | 305 | 8 | 2.6% |
| 17.50 | 306 | 10 | 3.3% |
| 17.75 | 323 | 4 | 1.2% |
| 18.00 | 299 | 8 | 2.7% |
| 18.25 | 332 | 8 | 2.4% |
| 18.50 | 309 | 9 | 2.9% |
| 18.75 | 307 | 7 | 2.3% |
| 19.00 | 356 | 8 | 2.2% |
| 19.25 | 389 | 5 | 1.3% |
| 19.50 | 361 | 5 | 1.4% |
| 19.75 | 343 | 6 | 1.7% |
| 20.00 | 402 | 8 | 2.0% |
| 20.25 | 379 | 6 | 1.6% |
| 20.50 | 359 | 3 | 0.8% |
| 20.75 | 353 | 5 | 1.4% |
| 21.00 | 344 | 1 | 0.3% |
| 21.25 | 317 | 3 | 0.9% |
| 21.50 | 341 | 2 | 0.6% |
| 21.75 | 331 | 1 | 0.3% |
| 22.00 | 369 | 1 | 0.3% |
| 22.25 | 336 | 0 | 0.0% |
| 22.50 | 316 | 2 | 0.6% |
| 22.75 | 280 | 3 | 1.1% |
| 23.00 | 311 | 1 | 0.3% |
| 23.25 | 290 | 3 | 1.0% |
| 23.50 | 279 | 1 | 0.4% |
| 23.75 | 255 | 1 | 0.4% |
| 24.00 | 246 | 1 | 0.4% |
| 24.25 | 219 | 0 | 0.0% |
| 24.50 | 230 | 2 | 0.9% |
| 24.75 | 230 | 1 | 0.4% |
| 25.00 | 212 | 2 | 0.9% |
| 25.25 | 207 | 0 | 0.0% |
| 25.50 | 176 | 1 | 0.6% |
| 25.75 | 154 | 0 | 0.0% |
| 26.00 | 154 | 1 | 0.6% |
| 26.25 | 113 | 0 | 0.0% |
| 26.50 | 137 | 0 | 0.0% |
| 26.75 | 122 | 0 | 0.0% |
| 27.00 | 95 | 0 | 0.0% |
| 27.25 | 98 | 0 | 0.0% |
| 27.50 | 83 | 0 | 0.0% |
| 27.75 | 81 | 0 | 0.0% |
| 28.00 | 82 | 0 | 0.0% |
| 28.25 | 55 | 1 | 1.8% |
| 28.50 | 56 | 0 | 0.0% |
| 28.75 | 51 | 0 | 0.0% |
| 29.00 | 48 | 0 | 0.0% |
| 29.25 | 34 | 0 | 0.0% |
| 29.50 | 24 | 0 | 0.0% |
| 29.75 | 25 | 0 | 0.0% |
| 30.00 | 24 | 0 | 0.0% |
| 30.25 | 21 | 0 | 0.0% |
| 30.50 | 18 | 0 | 0.0% |
| 30.75 | 23 | 0 | 0.0% |
| 31.00 | 16 | 0 | 0.0% |
| 31.25 | 15 | 0 | 0.0% |
| 31.50 | 8 | 0 | 0.0% |
| 31.75 | 3 | 0 | 0.0% |
| 32.00 | 6 | 0 | 0.0% |
| 32.25 | 7 | 0 | 0.0% |
| 32.50 | 6 | 0 | 0.0% |
| 32.75 | 3 | 0 | 0.0% |
| 33.00 | 4 | 0 | 0.0% |
| 33.25 | 6 | 0 | 0.0% |
| 33.50 | 5 | 0 | 0.0% |
| 34.75 | 4 | 0 | 0.0% |
| 35.00 | 2 | 0 | 0.0% |
| 35.50 | 1 | 0 | 0.0% |
| 36.00 | 2 | 0 | 0.0% |
| 36.25 | 1 | 0 | 0.0% |
| 36.50 | 1 | 0 | 0.0% |
| 37.25 | 1 | 0 | 0.0% |
| 37.75 | 2 | 0 | 0.0% |
| 42.25 | 1 | 0 | 0.0% |
The next steps are too involved to explain here, but I developed a formula for the probability of a shutout, given the number of estimated points.
p = Estimated points.
x = 1.562545 -0.302485 * p
probability of shutout = ex/(1+ex)
The following chart shows the actual and estimated probability of a shutout for 14 to 22 points.
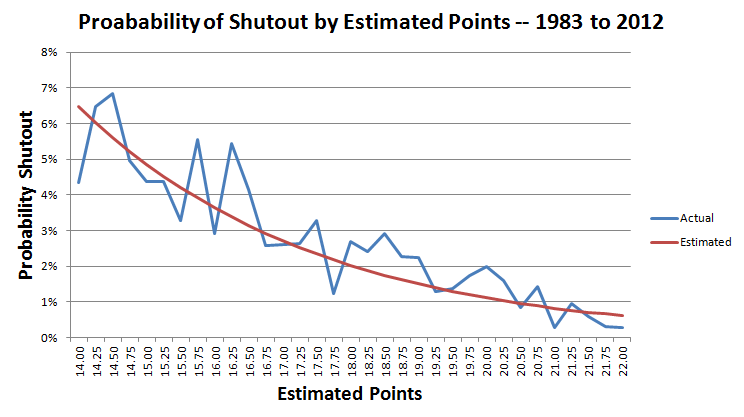
In the game in question the Giants expected to score 17 points.
Using the formula above the table:
x = 1.562545 -0.302485 * 17 = -3.579706
Probability of a shutout = exp(-3.579706)/( exp(-3.579706)+1) = 2.71%. To be exact, 0.0271275.
Given that the dealership would have had to pay $420,000 in the event of a Giants shutout, the fair cost of the policy would have been $420,000 × 0.0271275 = $11,394. Normally insurance companies that insure unusual promotions like this double the fair cost, so I would have expected to see a premium of $22,788. So, the $7,000 premium the dealership paid was a steal. Assuming the boss reviews the math, I wouldn't want to be in the shoes of the whoever calculated that $7,000 premium.
This question was raised and discussed in my forum at Wizard of Vegas.
What is the proof that there is no largest prime?
Let's assume, for a minute, there is a largest prime. We can number the primes p1=2, p2=3, p3=5, p4=7, ... pL = largest prime.
Now lets define the number x = p1*p2*p3*p4*...*pL + 1.
What it means to be prime is that no other smaller prime divides into it evenly.
If we divide p1, p2, p3, ... pL into x we get a remainder of 1 every time.
You might argue that maybe a prime bigger than pL divides into x evenly. Yes, but then you would have found a larger prime than the so-called largest prime. If not, then x becomes a new largest prime, proving the initial conjecture of the existence of a largest prime by contradiction.
This question was asked and discussed in my forum at Wizard of Vegas.
Do you agree with the article titled Math Says You Should Buy A Mega Millions Ticket Right Now at Business Insider?
No, I don't agree with it. That is a terrible piece of journalism and Business Insider should be embarrassed by it.
To begin, the article was published on Dec. 17, 2013, before the $636 million drawing that evening. Let's look at the math to evaluate the value of a $1 ticket. The following table shows the probability and expected return of all possible outcomes for the $636 million jackpot, before considering such things as the lump sum penalty, taxes, and jackpot sharing. The top three probabilities are in scientific notation because the numbers are so small.
Mega Millions -- $636 Million Jackpot
| Catch | Mega Ball | Pays | Combinations | Probability | Return |
|---|---|---|---|---|---|
| 5 | Yes | $636,000,000 | 1 | 3.86E-09 | 2.456634 |
| 5 | No | $1,000,000 | 14 | 5.41E-08 | 0.054077 |
| 4 | Yes | $5,000 | 350 | 1.35E-06 | 0.006760 |
| 4 | No | $500 | 4,900 | 0.000019 | 0.009463 |
| 3 | Yes | $50 | 24,150 | 0.000093 | 0.004664 |
| 3 | No | $5 | 338,100 | 0.001306 | 0.006530 |
| 2 | Yes | $5 | 547,400 | 0.002114 | 0.010572 |
| 1 | Yes | $2 | 4,584,475 | 0.017708 | 0.035416 |
| 0 | Yes | $1 | 12,103,014 | 0.046749 | 0.046749 |
| Loser | $0 | 241,288,446 | 0.932008 | 0.000000 | |
| Total | 258,890,850 | 1.000000 | 2.630865 | ||
That shows a $1 ticket will get back $2.630864. After deducting the dollar the ticket cost, the expected profit is $1.630864. Business Insider gets $1.632029. A difference of 0.001164, but no big deal.
However, there are three things that depress the value significantly:
- The lump sum penalty.
- Taxes.
- Jackpot sharing.
Let's look at them one at a time.
Large lottery progressive jackpots are usually paid out in the form of an annuity of about 30 years, including Mega Millions. If the winner wants the money all at once, which most do, he must take a significant reduction. This is only fair because a dollar today is worth more than a dollar in the future. In the case of the December 17, 2013 drawing, the total prize money was reduced to $347.6 million, or 54.65% of the advertised jackpot.
Next, let's look at taxes. The highest federal marginal income tax rate is 39.6%. State taxes range from 0% to 12.3%, so let's just say 6% on average. After taking out 45.6% in taxes, we're left with $189.1 million.
Now comes the trickiest part -- jackpot sharing. It should be noted that starting with the October 22, 2013 drawing Mega Millions changed the rules to a 75-15 format, where they draw five numbers from 1 to 75, and then one from a separate pool of 1 to 15. This reduced the odds of winning to 1 in 258,890,850, evidently in an effort to have bigger jackpots. Looking at just the 17 drawings since then, using jackpot and sales data from LottoReport.com, I find there is an exponential relationship between jackpot size and demand. I found the same thing for the Powerball lottery, by the way. Using exponential regression, my formula for total tickets sold (in millions) is 12.422 × exp(0.0052 × j), where j is the jackpot size (in millions). For example, for a $636 million jackpot, the expected sales would be 12.422 * exp(0.0052*636) = 339.2 (million). Actual sales were $337 million, so pretty close.
Based on the actual ticket sales of 336,545,306, we can expect 336,545,306/258,890,850 = 1.300 winners. The pertinent question is if you win how many other people can you expect to share the money with? This is easily answered looking at the Poisson distribution. Given a mean of 1.3 winners, the probability of exactly x winners is exp(1.3)×1.3x/fact(x). The following table shows the probability of 0 to 10 other winners, your share of the jackpot in each case, and expected share, assuming that you win.
Expected Jackpot Share Given 1.3 Other Winners on Average
| Other winners | Probability | Jackpot share | Expected share |
|---|---|---|---|
| 10 | 0.000001 | 0.090909 | 0.000000 |
| 9 | 0.000008 | 0.100000 | 0.000001 |
| 8 | 0.000055 | 0.111111 | 0.000006 |
| 7 | 0.000339 | 0.125000 | 0.000042 |
| 6 | 0.001827 | 0.142857 | 0.000261 |
| 5 | 0.008431 | 0.166667 | 0.001405 |
| 4 | 0.032429 | 0.200000 | 0.006486 |
| 3 | 0.099786 | 0.250000 | 0.024946 |
| 2 | 0.230283 | 0.333333 | 0.076761 |
| 1 | 0.354295 | 0.500000 | 0.177148 |
| 0 | 0.272545 | 1.000000 | 0.272545 |
| Total | 1.000000 | 0.559602 |
The bottom right cell shows that you can expect to keep 55.96% of the money, and the other 44.04% will go to those darned other winners you'll have to share with.
Now our $636 million jackpot is down to $189.1 × 55.96% = $105.8 million. Let's see what the return table looks like with that figure as the jackpot.
Mega Millions -- $105.8 Million Jackpot
| Catch | Mega Ball | Pays | Combinations | Probability | Return |
|---|---|---|---|---|---|
| 5 | Yes | $105,800,000 | 1 | 3.86E-09 | 0.408666 |
| 5 | No | $1,000,000 | 14 | 5.41E-08 | 0.054077 |
| 4 | Yes | $5,000 | 350 | 1.35E-06 | 0.006760 |
| 4 | No | $500 | 4,900 | 0.000019 | 0.009463 |
| 3 | Yes | $50 | 24,150 | 0.000093 | 0.004664 |
| 3 | No | $5 | 338,100 | 0.001306 | 0.006530 |
| 2 | Yes | $5 | 547,400 | 0.002114 | 0.010572 |
| 1 | Yes | $2 | 4,584,475 | 0.017708 | 0.035416 |
| 0 | Yes | $1 | 12,103,014 | 0.046749 | 0.046749 |
| Loser | $0 | 241,288,446 | 0.932008 | 0.000000 | |
| Total | 258,890,850 | 1.000000 | 0.582898 | ||
The bottom right cell shows that an expected return of 58.29%. In other words your $1 investment can expect to get back about 58 cents, for an expected loss, or house edge, of about 42%. Does that sound like the math saying you should buy a ticket?
According to the article, "So, as long as there are fewer than 730 million tickets sold, a fairly likely situation right now, the expected value of a ticket should be positive, and so you should consider buying a Mega Millions ticket today."
There were a lot fewer than 730 million in sales and it still was a terrible value. However, in all fairness, the article went on to say the following:
"Bear in mind that there are many caveats to this analysis. Taxes will likely hurt your expected winnings pretty severely — the Feds will take about 40%, and your home state will claim anywhere from 0% to around 13%.
A lot of people have been buying tickets, and as discussed above, this will greatly increase the odds of a tie, and the reduced payout that goes with it." — Business Insider
Those are some pretty big caveats! They shouldn't just be mentioned in passing at the bottom but factored into the analysis to begin with.
Not that you asked, but I find the math says you should never play Mega Millions. Given the exponential demand for tickets, based on jackpot size, I find the optimal time to play is a jackpot of $545 million. With jackpots larger than that you'll have to share it with too many other winners. At that jackpot size, the player can expect a return of 60.2%, or a loss of 39.8%. That is as good as it gets.
In closing, no, I do not agree with Business Insider for tricking readers with a sensational title and not doing a proper analysis of taxes and jackpot sharing.
This question is asked and discussed in my forum at Wizard of Vegas.