
Wizard Recommends
-
 $11000 Welcome Bonus
 -
 $3000 Welcome Bonus
 -
 UP TO $777 BONUS
Craps - Dice and Rolling
The question on the dice influence is a hotly debated topic. Personally, I'm very skeptical. As I review this reply in 2013 I still have yet to see convincing evidence anybody can influence enough to have an advantage.
The question I have about this bet is that 14.41% still isn’t "statistically significant" [ i.e. p < 0.05 ] , which is usually taken to mean greater than two Standard Deviations from the Mean -- or a probability of less than a *combined* 5% of the event happening randomly on EITHER end of the series.
How many Sevens would have to be rolled in 500 rolls before you could say that there is a less than 2.5% chance that the outcome was entirely random (i.e. that the outcome was statistically significant) ?
Many Thanks & BTW , yours is ABSOLUTELY the BEST web site on the subject of gambling odds & probabilities that I’ve found .... keep up the good work !!!
The 2.5% level of significance is 1.96 standard deviations from expectations. This can be found with the formula =normsinv(0.025) in Excel. The standard deviation of 500 rolls is sqr(500*(1/6)*(5/6)) = 8.333. So 1.96 standard deviations is 1.96 * 8.333 = 16.333 rolls south of expectations. The expected number of sevens in 500 throws is 500*(1/6) = 83.333. So 1.96 standard deviations south of that is 83.333 − 16.333 = 67. Checking this using the binomial distribution, the exact probability of 67 or fewer sevens is 2.627%.
For example, suppose the claimant says he can average one total of seven every seven throws of the dice. A random shooter would throw one seven every six throws, on average. By trial and error I find that a test meeting both these criteria would be to throw the dice 3,600 times, and require 547 or fewer sevens to pass, or one seven per 6.58 rolls.
A one in seven shooter should average 514.3 sevens, with a standard deviation of 21.00. Using the Gaussian approximation, the probability of such a skilled shooter throwing 548 or more sevens (a false negative) is 5.7%. A random shooter should average 600 sevens, with a standard deviation of 22.36. The probability of a random shooter passing the test (a false positive) is 0.94%. The graph below shows the possibe results for skilled and random shooters. If the results are to the left of the green line, then I would consider the shooter to have passed the test, and I would bet on him.
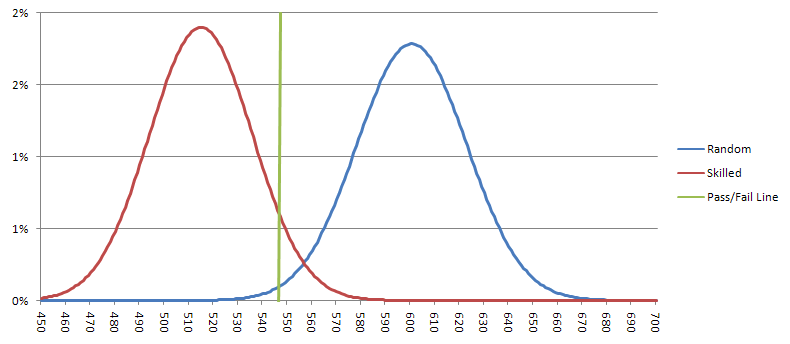
The practical dilemma is if we assume two throws per minute, it would take 30 hours to conduct the test. Perhaps I could be more liberal about the significance level, to cut down the time requirement, but the results would not be as convincing. I do think the time has come for a bigger test than the 500-roll Wong experiment.
Also see my solution, expressed in matrices, at mathproblems.info, problem 204.
| Dice Test Data | |
| Dice Total | Observations |
| 2 | 6 |
| 3 | 12 |
| 4 | 14 |
| 5 | 18 |
| 6 | 23 |
| 7 | 50 |
| 8 | 36 |
| 9 | 37 |
| 10 | 27 |
| 11 | 14 |
| 12 | 7 |
| Total | 244 |
The chi-squared test is perfectly suited to this kind of question. To use the test, take (a-e)2/e for each category, where a is the actual outcome, and e is the expected outcome. For example, the expected number of rolls totaling 2 in 244 throws is 244×(1/36) = 6.777778. If you don’t understand why the probability of rolling a 2 is 1/36, then please read my page on dice probability basics. For the chi-squared value for a total of 2, a=6 and e=6.777778, so (a-e)2/e = (6-6.777778)2/6.777778 = 0.089253802.
Chi-Squared Results
| Dice Total | Observations | Expected | Chi-Squared |
| 2 | 6 | 6.777778 | 0.089253 |
| 3 | 12 | 13.555556 | 0.178506 |
| 4 | 14 | 20.333333 | 1.972678 |
| 5 | 18 | 27.111111 | 3.061931 |
| 6 | 23 | 33.888889 | 3.498725 |
| 7 | 50 | 40.666667 | 2.142077 |
| 8 | 36 | 33.888889 | 0.131512 |
| 9 | 37 | 27.111111 | 3.607013 |
| 10 | 27 | 20.333333 | 2.185792 |
| 11 | 14 | 13.555556 | 0.014572 |
| 12 | 7 | 6.777778 | 0.007286 |
| Total | 244 | 244 | 16.889344 |
Then take the sum of the chi-squared column. In this example, the sum is 16.889344. That is called the chi-squared statistic. The number of "degrees of freedom" is one less than the number of categories in the data, in this case 11-1=10. Finally, either look up a chi-squared statistic of 10.52 and 10 degrees of freedom in a statistics table, or use the formula =chidist(16.889344,10) in Excel. Either will give you a result of 7.7%. That means that the probability fair dice would produce results this skewed or more is 7.7%. The bottom line is while these results are more skewed than would be expected, they are not skewed enough to raise any eyebrows. If you continue this test, I would suggest collecting the individual outcome of each die, rather than the sum. It should also be noted that the chi-squared test is not appropriate if the expected number of outcomes of a category is low. A minimum expectation of 5 is a figure commonly bandied about.
Whether or not it is called a valid roll depends on where you are. New Jersey gaming regulation 19:47-1.9(a) states:
A roll of the dice shall be invalid whenever either or both of the dice go off the table or whenever one die comes to rest on top of the other. -- NJ 19:47-1.9(a)
Pennsylvania has the exact same regulation, Section 537.9(a):
A roll of the dice shall be invalid whenever either or both of the dice go off the table or whenever one die comes to rest on top of the other. -- PA 537.9(a)
I asked a Las Vegas dice dealer who said that here it would be called a valid roll, if it was otherwise a proper throw. Although he has never seen it happen, he said if it did the dealers would simply move the top die to see what number the lower die landed on. However, one can determine the outcome of the lower die without touching, or looking through, the top die. Here is how to do it. First, by looking at the four sides you can narrow down the possibilities on top to two. Here is how to tell according to the three possibilities.
- 1 or 6: Look for the 3. If the high dot is bordering the 5, the 1 is on top. Otherwise, if it is bordering the the 2, the 6 is on top.
- 2 or 5: Look for the 3. If the high dot is bordering the 6, the 2 is on top. Otherwise, if it is bordering the the 1, the 5 is on top.
- 3 or 4: Look for the 2. If the high dot is bordering the 6, the 3 is on top. Otherwise, if it is bordering the the 1, the 4 is on top.
This question was raised and discussed in the forum of my companion site Wizard of Vegas.
This question was asked at TwoPlusTwo.com, and was answered correctly by BruceZ. The following solution is the same method as that of BruceZ, who deserves proper credit. It is a difficult answer, so pay attention.
First, consider the expected number of rolls to obtain a total of two. The probability of a two is 1/36, so it would take 36 rolls on average to get the first 2.
Next, consider the expected number of rolls to get both a two and three. We already know it will take 36 rolls, on average, to get the two. If the three is obtained while waiting for the two, then no additional rolls will be needed for the 3. However, if not, the dice will have to be rolled more to get the three.
The probability of a three is 1/18, so it would take on average 18 additional rolls to get the three, if the two came first. Given that there is 1 way to roll the two, and 2 ways to roll the three, the chances of the two being rolled first are 1/(1+2) = 1/3.
So, there is a 1/3 chance we'll need the extra 18 rolls to get the three. Thus, the expected number of rolls to get both a two and three are 36+(1/3)×18 = 42.
Next, consider how many more rolls you will need for a four as well. By the time you roll the two and three, if you didn't get a four yet, then you will have to roll the dice 12 more times, on average, to get one. This is because the probability of a four is 1/12.
What is the probability of getting the four before achieving the two and three? First, let's review a common rule of probability for when A and B are not mutually exclusive:
pr(A or B) = pr(A) + pr(B) - pr(A and B)
You subtract pr(A and B) because that contingency is double counted in pr(A) + pr(B). So,
pr(4 before 2 or 3) = pr(4 before 2) + pr(4 before 3) - pr(4 before 2 and 3) = (3/4)+(3/5)-(3/6) = 0.85.
The probability of not getting the four along the way to the two and three is 1.0 - 0.85 = 0.15. So, there is a 15% chance of needing the extra 12 rolls. Thus, the expected number of rolls to get a two, three, and four is 42 + 0.15*12 = 43.8.
Next, consider how many more rolls you will need for a five as well. By the time you roll the two to four, if you didn't get a five yet, then you will have to roll the dice 9 more times, on average, to get one, because the probability of a five is 4/36 = 1/9.
What is the probability of getting the five before achieving the two, three, or four? The general rule is:
pr (A or B or C) = pr(A) + pr(B) + pr(C) - pr(A and B) - pr(A and C) - pr(B and C) + pr(A and B and C)
So, pr(5 before 2 or 3 or 4) = pr(5 before 2)+pr(5 before 3)+pr(5 before 4)-pr(5 before 2 and 3)-pr(5 before 2 and 4)-pr(5 before 3 and 4)+pr(5 before 2, 3, and 4) = (4/5)+(4/6)+(4/7)-(4/7)-(4/8)-(4/9)+(4/10) = 83/90. The probability of not getting the four along the way to the two to four is 1 - 83/90 = 7/90. So, there is a 7.78% chance of needing the extra 7.2 rolls. Thus, the expected number of rolls to get a two, three, four, and five is 43.8 + (7/90)*9 = 44.5.
Continue with the same logic, for totals of six to twelve. The number of calculations required for finding the probability of getting the next number before it is needed as the last number roughly doubles each time. By the time you get to the twelve, you will have to do 1,023 calculations.
Here is the general rule for pr(A or B or C or ... or Z)
pr(A or B or C or ... or Z) =
pr(A) + pr(B) + ... + pr(Z)
- pr (A and B) - pr(A and C) - ... - pr(Y and Z) Subtract the probability of every combination of two events
+ pr (A and B and C) + pr(A and B and D) + ... + pr(X and Y and Z) Add the probability of every combination of three events
- pr (A and B and C and D) - pr(A and B and C and E) - ... - pr(W and X and Y and Z) Subtract the probability of every combination of four eventsThen keep repeating, remembering to add probability for odd number events and to subtract probabilities for an even number of events. This obviously gets tedious for large numbers of possible events, practically necessitating a spreadsheet or computer program.
The following table shows the the expected number for each step along the way. For example, 36 to get a two, 42 to get a two and three. The lower right cell shows the expected number of rolls to get all 11 totals is 61.217385.
Expected Number of Rolls Problem
| Highest Number Needed | Probability | Expected Rolls if Needed | Probability not Needed | Probability Needed | Expected Total Rolls |
|---|---|---|---|---|---|
| 2 | 0.027778 | 36.0 | 0.000000 | 1.000000 | 36.000000 |
| 3 | 0.055556 | 18.0 | 0.666667 | 0.333333 | 42.000000 |
| 4 | 0.083333 | 12.0 | 0.850000 | 0.150000 | 43.800000 |
| 5 | 0.111111 | 9.0 | 0.922222 | 0.077778 | 44.500000 |
| 6 | 0.138889 | 7.2 | 0.956044 | 0.043956 | 44.816484 |
| 7 | 0.166667 | 6.0 | 0.973646 | 0.026354 | 44.974607 |
| 8 | 0.138889 | 7.2 | 0.962994 | 0.037006 | 45.241049 |
| 9 | 0.111111 | 9.0 | 0.944827 | 0.055173 | 45.737607 |
| 10 | 0.083333 | 12.0 | 0.911570 | 0.088430 | 46.798765 |
| 11 | 0.055556 | 18.0 | 0.843824 | 0.156176 | 49.609939 |
| 12 | 0.027778 | 36.0 | 0.677571 | 0.322429 | 61.217385 |
This question was raised and discussed in the forum of my companion site Wizard of Vegas.
If anybody has legitimate evidence of biased dice, I'd be happy to examine it and publish my conclusions. Evidence I would like to see are either log files of rolls or, better yet, some actual alleged biased dice.
Furthermore, if the casinos really were using dice that produced more than the expected number of sevens, then why aren't these detectives privy to the conspiracy out there betting the don't pass and laying the odds?
- 2 or 12: 1,000
- 3 or 11: 600
- 4 or 10: 400
- 5 or 9: 300
- 6 or 8: 200
My question is what is average bonus win?
Click the following button for the answer.
Click the following button for the solution.
I won't go into the basics of dice probabilities but just say the probability of each total is as follows:
- 2: 1/36
- 3: 2/36
- 4: 3/36
- 5: 4/36
- 6: 5/36
- 7: 6/36
- 8: 5/36
- 9: 4/36
- 10: 3/36
- 11: 2/36
- 12: 1/36
Before considering the consolation prize, the value of x can be expressed as:
x = (1/36)*(1000 + x) + (2/36)*(600 + x) + (3/36)*(400 + x) + (4/36)*(300 + x) + (5/36)*(200 + x) + (5/36)*(200 + x) + (4/36)*(300 + x) + (3/36)*(400 + x) + (2/36)*(600 + x) + (1/36)*(1000 + x)Next, multiply both sides by 36:
36x = (1000 + x) + 2*(600 + x) + 3*(400 + x) + 4*(300 + x) + 5*(200 + x) + 5*(200 + x) + 4*(300 + x) + 3*(400 + x) + 2*(600 + x) + (1000 + x)36x = 11,200 + 30x
6x = 11,200
x = 11,200/6 = 1866.67.
Next, the value of the consolation prize is 700*(6/36) = 116.67.
Thus, the average win of the bonus is 1866.67 + 116.67 = 1983.33.