Wizard Recommends
-
 $11000 Welcome Bonus
 -
 $3000 Welcome Bonus
 -
 UP TO $777 BONUS
On this page
Golden Hits
Introduction
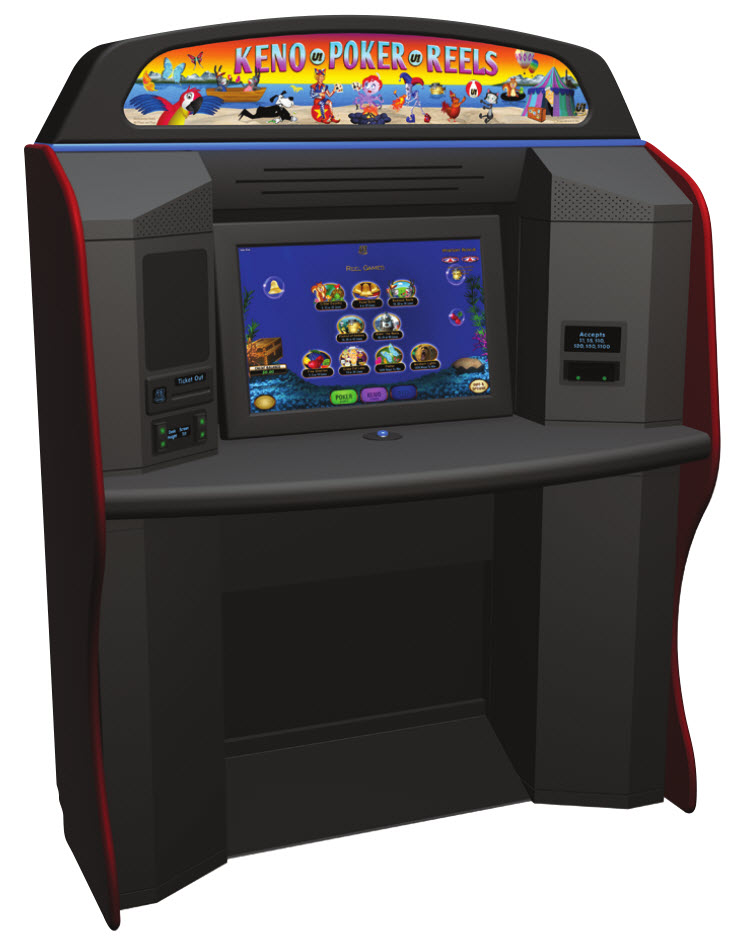
Golden Hits is a keno-based game found on multi-game machines made by U1 Gaming. I have seen such machines at the Las Vegas Club, Rampart, El Cortez, and Dotty's casinos in Las Vegas. The thrust of Golden Hits is if the player gets zero hits, then the game will pick another 16-24 balls, according to the number of player picks.
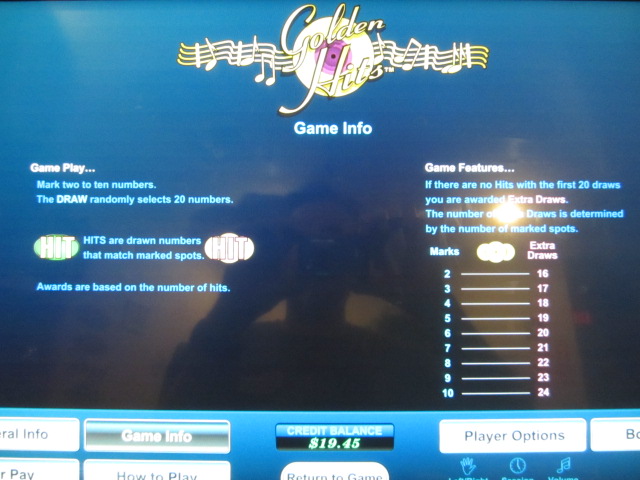
Rules
- The player chooses 2 to 10 numbers from a range of 1 to 80.
- The game will choose 20 numbers from the same 1 to 80 range.
- The player will be paid according to the number of his picks that match the random ball draw and the pay table. This is known as the number of "hits."
- If the player gets zero hits, then the game will draw more balls, according to the following table.
Multiplier Table
Player
PicksExtra
Balls10 24 9 23 8 22 7 21 6 20 5 19 4 18 3 17 2 16
As with all games by U1 Gaming, there is also a randomly-triggered bonus game, that adds 0.5025% to the return.
Pay Table
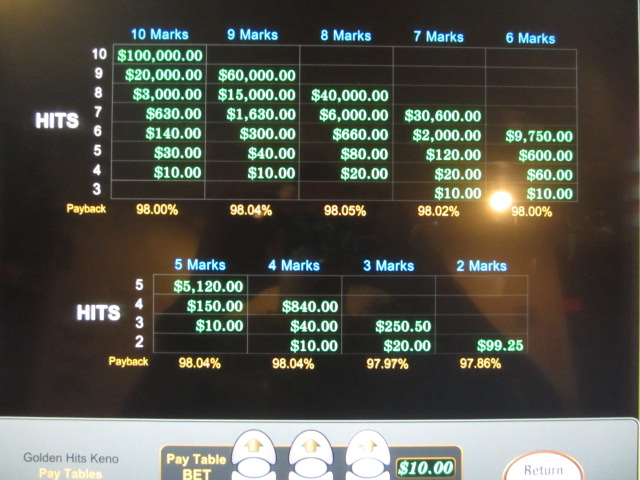
The following pay table is for bets of $10 or higher. Generally speaking, with U1 games, the more you bet, the more generous the pay table is.
Pay Table for $10 Bet or More
| Hit | Pick | ||||||||
|---|---|---|---|---|---|---|---|---|---|
| 10 | 9 | 8 | 7 | 6 | 5 | 4 | 3 | 2 | |
| 10 | 10,000 | ||||||||
| 9 | 2,000 | 6,000 | |||||||
| 8 | 300 | 1,500 | 4,000 | ||||||
| 7 | 63 | 163 | 600 | 3,060 | |||||
| 6 | 14 | 30 | 66 | 200 | 975 | ||||
| 5 | 3 | 4 | 8 | 12 | 60 | 512 | |||
| 4 | 1 | 1 | 2 | 2 | 6 | 15 | 84 | ||
| 3 | 0 | 0 | 0 | 1 | 1 | 1 | 4 | 25.05 | |
| 2 | 0 | 0 | 0 | 0 | 0 | 0 | 1 | 2 | 9.925 |
| 1 | 0 | 0 | 0 | 0 | 0 | 0 | 0 | 0 | 0 |
| 0 | 0 | 0 | 0 | 0 | 0 | 0 | 0 | 0 | 0 |
Example
 |
 |
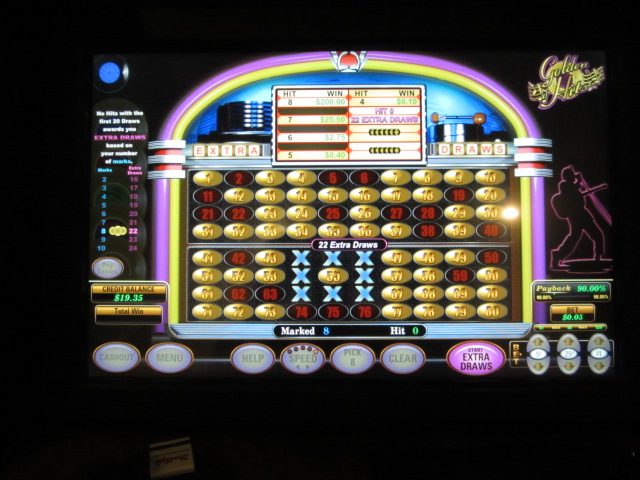
Here is an example to help understand the game. In the image above and on the left, I picked eight numbers and got zero hits. The pink "start extra balls" button lit up, ready to give me 22 extra balls. Keep in mind that 20 losing balls have already been removed, so each ball in the second draw has a greater chance of being a hit.
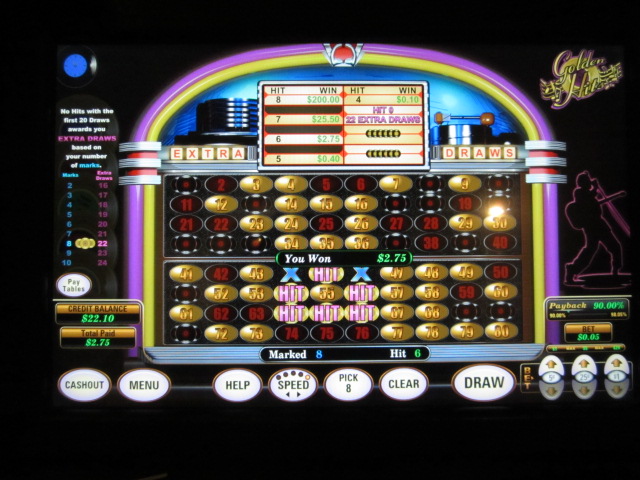
The image on the right shows that of the 22 extra balls, six were hits, paying $2.75. Considering my original bet was $0.05, this paid 55 for 1.
Odds
The following tables are based on the pay table for a $10 bet.
The following table shows the probability of each number of hits by number of picks on the initial 20-ball draw, rounded to six decimal places.
The following table shows the return for each number of picks and hits before considering the extra draw feature. The bottom row shows the return of the game, before considering the feature.
The next table shows the probability of each number of catches by picks in the extra draw feature.
The next table shows the expected return for each number of hits by catches in the extra draw feature. The bottom row shows the total expected return for each number of picks.
The next table shows the probability of the feature, average win per feature, and expected return from the feature, according to the number of picks.
Feature Summary
| Pick | Probability Feature |
Average Return |
Expected Return |
|---|---|---|---|
| 10 | 0.045791 | 7.801770 | 0.357249 |
| 9 | 0.063748 | 6.426869 | 0.409699 |
| 8 | 0.088266 | 4.489340 | 0.396257 |
| 7 | 0.121574 | 3.052268 | 0.371077 |
| 6 | 0.166602 | 2.175989 | 0.362524 |
| 5 | 0.227184 | 1.672038 | 0.379861 |
| 4 | 0.308321 | 1.078391 | 0.332491 |
| 3 | 0.416504 | 0.839568 | 0.349684 |
| 2 | 0.560127 | 0.672881 | 0.376899 |
The following table shows the summary of the entire game. The right column shows the total return by number of picks. You can see my total returns agree with those claimed by the game to within 0.01%.
Game Summary
| Pick | Base Game |
Feature | Random Bonus |
Total |
|---|---|---|---|---|
| 10 | 0.617805 | 0.357249 | 0.005025 | 0.980078 |
| 9 | 0.565776 | 0.409699 | 0.005025 | 0.980500 |
| 8 | 0.579287 | 0.396257 | 0.005025 | 0.980569 |
| 7 | 0.604124 | 0.371077 | 0.005025 | 0.980227 |
| 6 | 0.612546 | 0.362524 | 0.005025 | 0.980094 |
| 5 | 0.595522 | 0.379861 | 0.005025 | 0.980407 |
| 4 | 0.642952 | 0.332491 | 0.005025 | 0.980468 |
| 3 | 0.625085 | 0.349684 | 0.005025 | 0.979794 |
| 2 | 0.596756 | 0.376899 | 0.005025 | 0.978680 |