Wizard Recommends
-
 $11000 Welcome Bonus
 -
 $3000 Welcome Bonus
 -
 UP TO $777 BONUS
Ask The Wizard #350
In the National Hockey League, in a regular season game, if a game ends in the regulation time, two points are awarded to the winner and zero to the loser. However, if the game goes into overtime, then the winner still gets two points, but the loser will get one point. Meanwhile, there is no such incentive to get to overtime in the playoffs.
Do you think that if the game is tied late in the game, during the regular season, both teams will kill the clock to try to get to overtime? It would seem logical to do so, because there will be three points awarded between the two teams, instead of two.
There does indeed seem to be an incentive to get to overtime in Hockey, for the reason you state. Let's look at some data to answer your question. The following data is from four hockey seasons, starting with the 2017/2018 season.
The following table breaks down the 7,846 games played over the four seasons between whether it was a regular seaon or playoff game and whether it went into overtime. The table shows that during the regular season, 11.27% of games went into overtime, while during the playoffs 54/544 = 9.03% did.
NHL Overtime Data
| Season | Overtime | Games |
|---|---|---|
| Regular | Yes | 817 |
| Regular | No | 6431 |
| Playoffs | Yes | 54 |
| Playoffs | No | 544 |
The question is whether this difference between 11.27% and 9.03% is statistically significant or perhaps explained by normal variance. To test two sample means, I'm going to do a chi-squared test, like the Comparison of proportions calculator at MedCalc.org. Over all 7,846 games, 871 went into overtime for a probability of 11.10%. The probability of no overtime is 88.90% over the same sample. If we assume there is no statistically significant difference between regular season and playoff games, then 804.6 regular season games should have gone into overtime and 66.4 playoff games.
The following table compares the actual results against expectations, under the assumption that the true probability of overtime is the same for both regular seasons and playoff games. The right column shows the chi-squared statistic, which is the square of the difference between the actual and expected totals, divided by the expected total.
NHL Overtime Data — Chi-Squared Test
| Season | Overtime | Actual Total |
Expected Total |
X^2 |
|---|---|---|---|---|
| Regular | Yes | 817 | 804.61 | 0.190641 |
| Regular | No | 6431 | 6443.39 | 0.023806 |
| Playoffs | Yes | 54 | 66.39 | 2.310641 |
| Playoffs | No | 544 | 531.61 | 0.288540 |
| Total | 7846 | 7846.00 | 2.813628 |
The table above shows a chi-squared statistic of 2.813628. With one degree of freedom, the probability of results this skewed or more is 9.347%. In other words, if there were no change in behavior between a regular season and play off game, resulting in a truly equal probability of overtime, the probability we would see such a 2.24% disparity in games going into overtime, or more, is 9.347%. To put it in simple English, this evidence does point towards a statistically significant difference between overtime rates between the two types of games. However, there is still a 9.35% chance that it can be explained as normal random variance.
I should add that the MedCalc calculator I linked to, as well as other sources, apply an "N-1" adjustment to the chi-squared statistic. To be specific, they multiply the chi-squared statistic by (N-1)/N, where N is the total number of observations. This this case, the adjusted chi-squuared statistic would be 2.813628 * (7845/7846) = 2.813270. The p value for this chi-squared statistic with one degree of freedom is 9.349%. I hate to muddy the waters with this minor adjustment, but if I didn't, I'm sure my readers would wonder why I didn't.
Personally, I believe teams do play to get to overtime moreso in the regular season than the playoffs and the data helps support this, but the data doesn't make the case beyond a reasonable doubt.
External Links
- Use of the Chi-Square Statistic at Johns Hopkins Bloomberg School of Public Heath.
Which is more likely:
- Justin Verlander throwing 100 straight strikes.
- Steph Curry making 100 straight free throws.
- Justin Tucker hitting 100 straight 40-yard field goal attempts.
Verlander is going to be tricky to estimate, so let's do him last.
In the 2019/2020 season, Steph Curry had a free throw percentage of 93.10% (source: Basketball Reference).
The NFL average for a 40-yard field goal is 85.83%. However, I would argue that Tucker is better than average. For field goals in the 30 to 39 yard range, the NFL average is 89.32%, but for Tucker is 96.63%. Applying this Tucker percentage to the NFL average, I estimate Tucker's probability of making a 40-yard field goal to be 85.85% × (96.63%/89.32%) = 92.86%.
Things get tricky when it comes to baseball. It must be asked if we are talking about actual pitches in real games or in a controlled demonstration. The reason this matters is in real games pitcher do not strive to throw a strike every time. Most of the time they strive to throw near the edge of the strike zone, making it harder for the batter to get a clean hit.
I have no statistics to back this up, but I've watched pitchers in the bull pen in minor league games who seem to put it right in the catcher's mit, without the catcher needing to move, almost every time. I roughly estimate that a pitcher like Verlander could throw a strike in a controlled test at least 95% of the time. However, in actual games, Verlander's strike percentage is only 68.50%.
To get the probability of 100 straight successful trials, ignoring a fatigue factor, just take the probability of a single successful trial to the 100th power.
Bottom line is if we're talking about a controlled experiment, I'll go with Verlander and in actual game conditions I'll go with Curry.
This question was originally asked at Barstool Sports. There is much discussion about it, as well, in my forum at Wizard of Vegas.
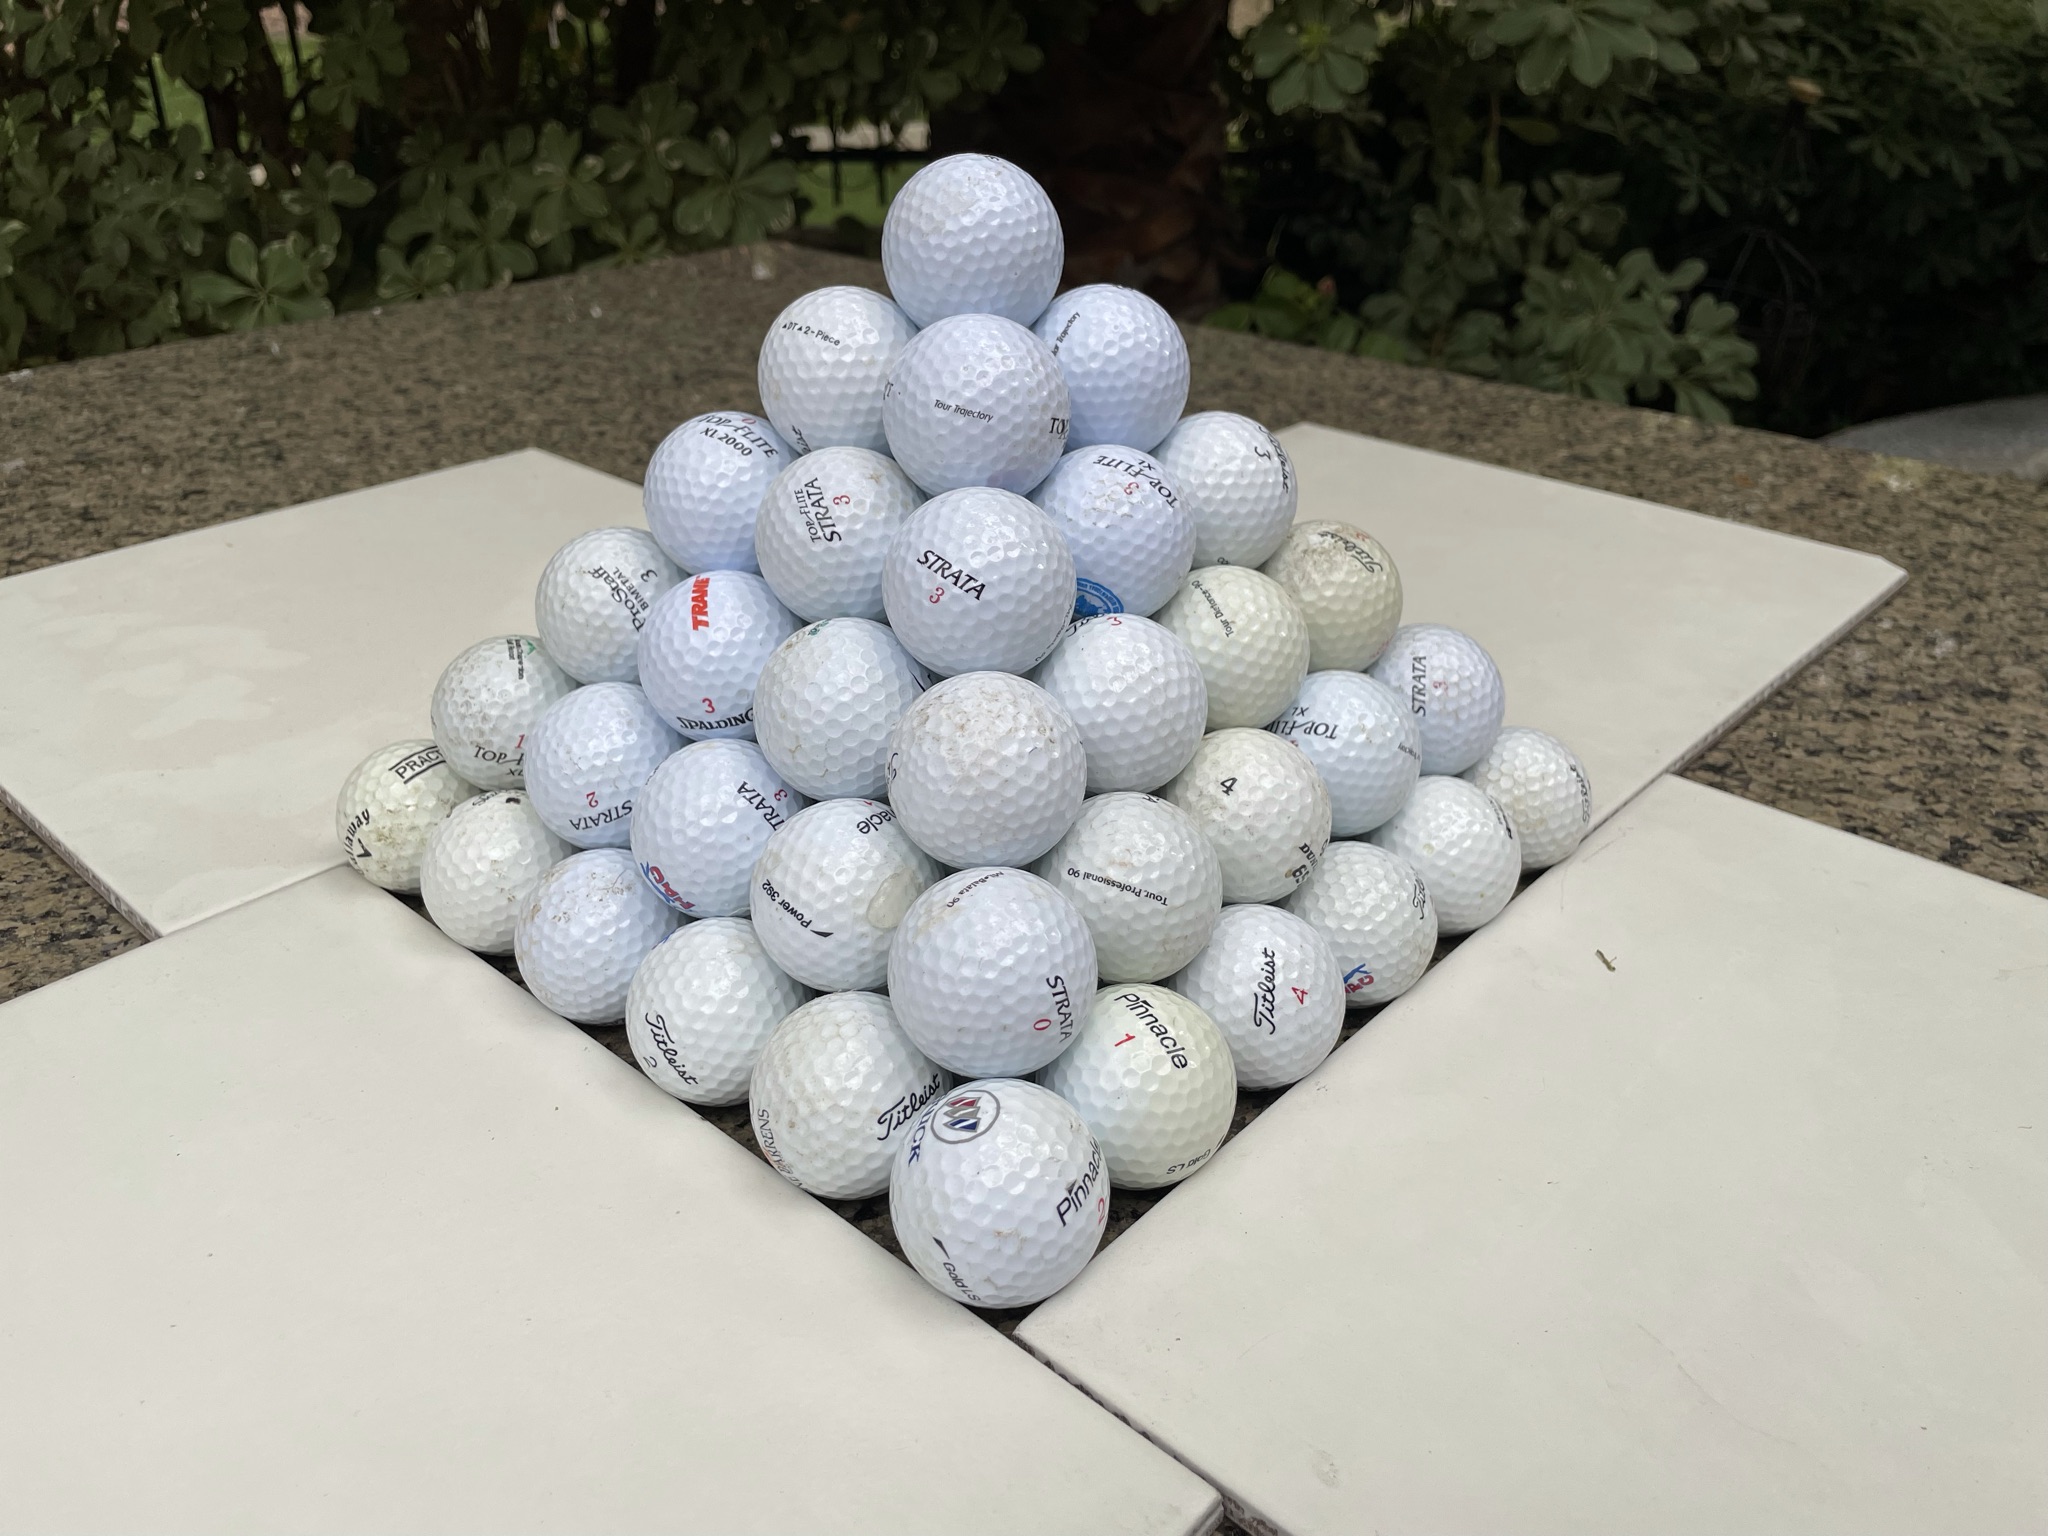
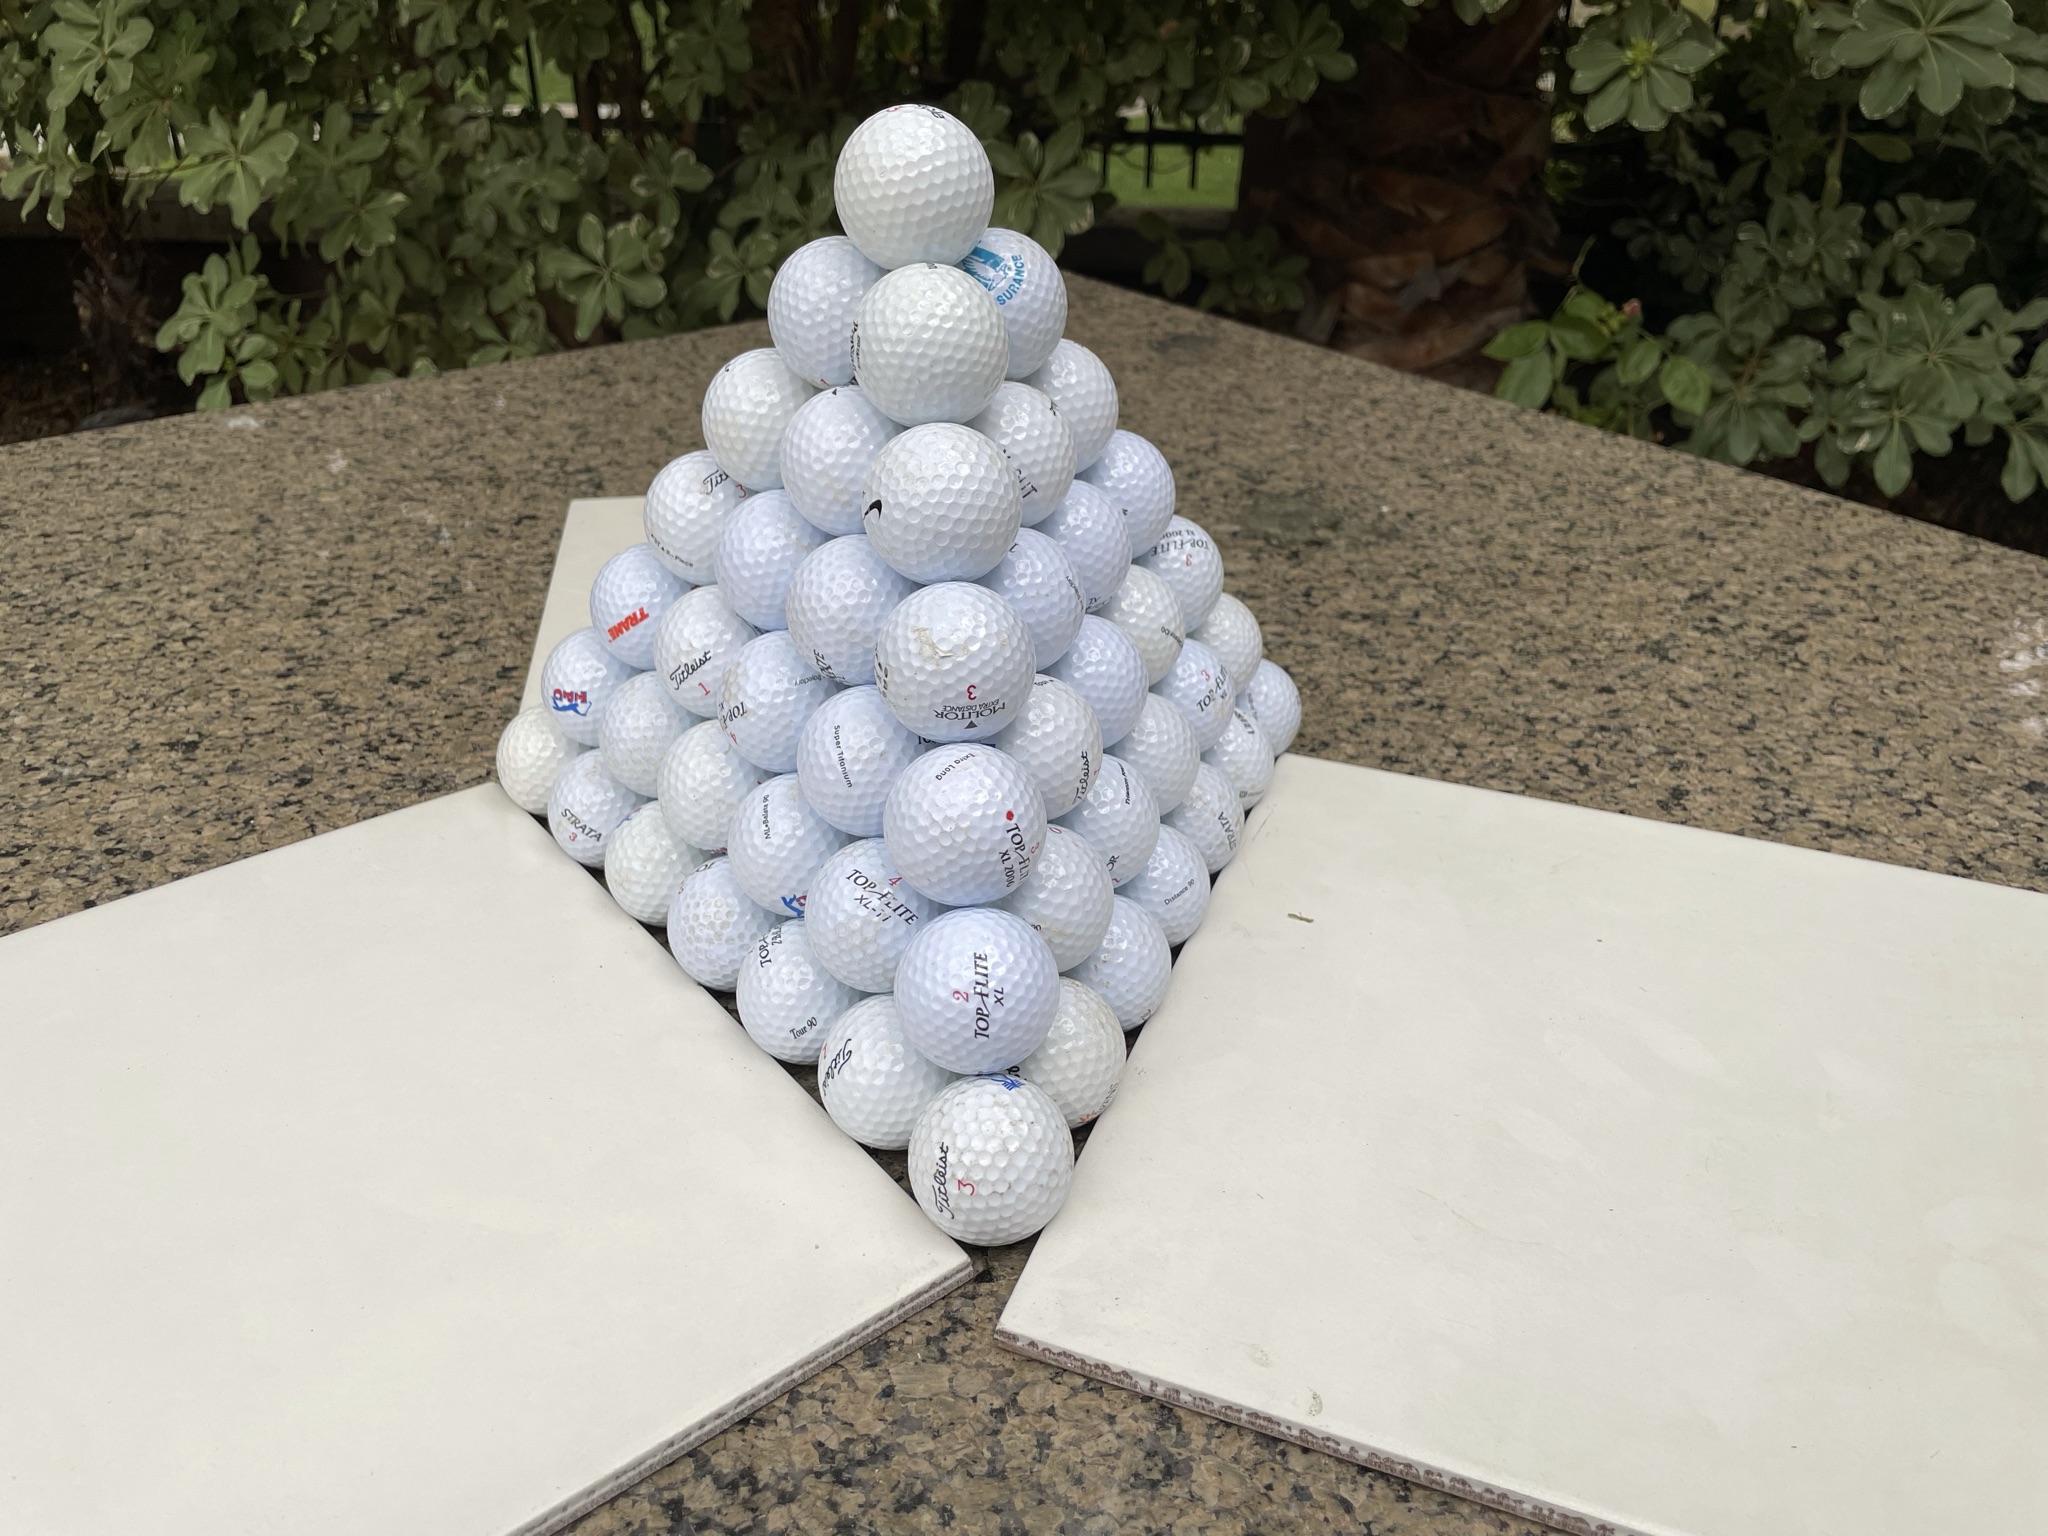
Which is the more efficient way to stack cannonballs, in a pyramid with a square base, like the pyramids of Egypt, or triangular, forming a tetrahedron?
Here are a couple formulas the reader may find helpful:
Scroll down for my answer and solution.
By "efficient," I shall assume you mean which has the least wasted space between cannonballs.
To keep things simple, to define the volume of either pyramid, let's use the center of the balls located at the corners of the pyramid. Let's let n be the number of cannonballs in a side of the base of either pyramid.
Let's look at the pyramid with square base first.
The number of cannonballs in the whole pyramid is 12 + 22 + 32 + 42 + 52 + 62 + ... + n2 = n*(n+1)*(2n+1)/6.
Next, let's find the height of this square pyramid where a side of the base is n. As can be seen in the picture, the sides (other than the square base) are equilateral triangles. Thus, the slant height is also n. The distance from one corner of the base to the opposite corner is n*sqrt(2). The distance from a corner of the base to the center of the base is thus n*sqrt(2)/2. Let the height be h. Consider the right triangle formed by the height, distance from a corner of the base to the center of the base, and the slant height.
h2 + (n*sqrt(2)/2)2 = n2
h = n*sqrt(2)/2.
Recall the volume of a pyramid is base*height/3. That makes the volumne of the pyramid:
n2 * n* sqrt(2)/2 * (1/3) = n3*sqrt(2)/6.The ratio of balls to volume is thus [n*(n+1)*(2n+1)/6] / [n3*sqrt(2)/6] = sqrt(2)*n*(n+1)*(2n+1)/(2*n3) = sqrt(2)*(n+1)*(2n+1)/(2*n2)
Next, let's look at the pyramid with a triangular base.
The number of cannonballs in the whole pyramid is 1 + 3 + 6 + 10 + 15 + ... + n*(n+1)/2 = n*(n+1)*(n+2)/6.
Next, let's find the area of the base. Recall, the sides of a 30-60-90 triangle are proportional to 1/2, sqrt(3)/2, and 1. From that, it is not difficult to find the height of an equalateral trinagle of side n is n*sqrt(3)/2. This makes the area of the base n2*sqrt(3)/4.
The distance from a corner of the base to the center of the base is sqrt(3)/3. Given that and the slant height of 1 of the pyramid, we can use Pythagorean to find the height of the pyramid as sqrt(6)/3.
We can now find the volume of the pyramid as base*height/3 = (n2*sqrt(3)/4) * (n*sqrt(6)/3) * (1/3) = n3*sqrt(18)/36 = n3*sqrt(2)/12.
The ratio of balls to volume is thus [n*(n+1)*(n+2)/6] / [n3*sqrt(2)/12] = sqrt(2)*n*(n+1)*(2n+1)/(2*n3) = sqrt(2)*(n+1)*(n+2)/n2
Here is a comparison of the balls to volume ratios:
- Square base: sqrt(2)*(n+1)*(2n+1)/(2*n2)
- Triangle base: sqrt(2)*(n+1)*(n+2)/n2
Let's divide both ratios by sqrt(2)*(n+1)/n2:
- Square base: (2n+1)/2 = n + 0.5
- Triangle base: n+2
As n gets larger, the ratio of balls to volume will approach n for both pyramids. In other words, the large numbers of cannonballs, the more they are equally efficient.
Given the volume of a cannonball, the efficiency in both pyramids, defined as the ratio of cannonball volume to total volume, approaches pi*sqrt(2)/6 =~ apx. 74.05%.
This question is asked and discussed in my forum at Wizard of Vegas.