Wizard Recommends
-
 $11000 Welcome Bonus
 -
 $3000 Welcome Bonus
 -
 UP TO $777 BONUS
Ask The Wizard #334
Your task is to get from square 0 to square 19. You may not take a path of the same color twice in a row. In other words, at every square you must change to a path of another color. No u-turns. What is the solution?
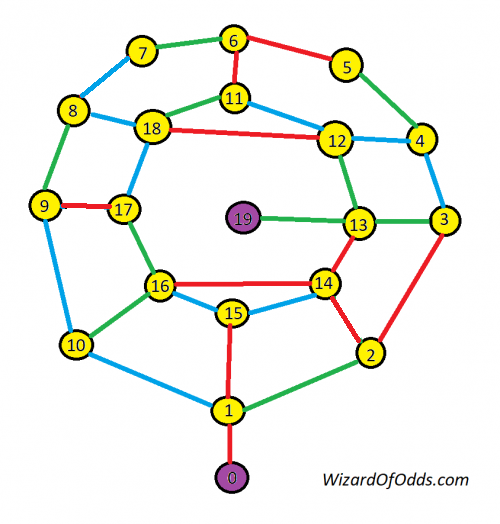
Puzzle by David Pleacher.
I encourage my readers to solve this for themselves. However, if you give up, you may click the solution button below.
Here is one possible solution: 0, 1, 2, 3, 4, 5, 6, 7, 8, 9, 17, 18, 12, 11, 18, 17, 9, 8, 7, 6, 5, 4, 3, 2, 1, 15, 14, 13, 19.
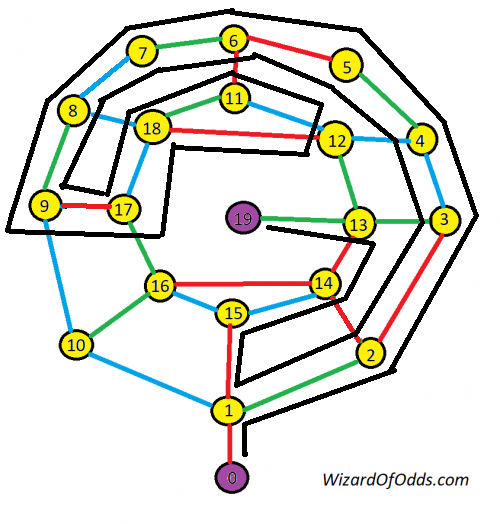
The key is to notice that you can make a u-turn in the 11-12-18 triangle. The solution is to go the whole way around the outside circle, in a counter-clockwise rotation until you get back to 1. Then take the inner circle clockwise to 18. Then make a u-turn and get back to 18. Then retrace your steps back to 1. Then it is an easy path to 19 from there.
A, B, C, and D are all different positive integers.
A < B < C < D
Find the largest D so that
1/A + 1/B + 1/C + 1/D = 1
The answer is 42. A, B, and C are 2, 3, and 7.
1/2 + 1/3 + 1/7 + 1/42 = 1.
This question is asked and discussed in my forum at Wizard of Vegas.
On October 15, 2020, in a televised Town Hall, President Trump said that 85% of people who wear masks catch the coronavirus. Is this true? Please refer to the video below. He quotes the 85% figure at the 45 second point.
The 85% refers to the table on page four of the report Community and Close Contact Exposures Associated with COVID-19 Among Symptomatic Adults ≥18 Years in 11 Outpatient Health Care Facilities — United States, July 2020 by the Center for Disease Control. Here is that table.
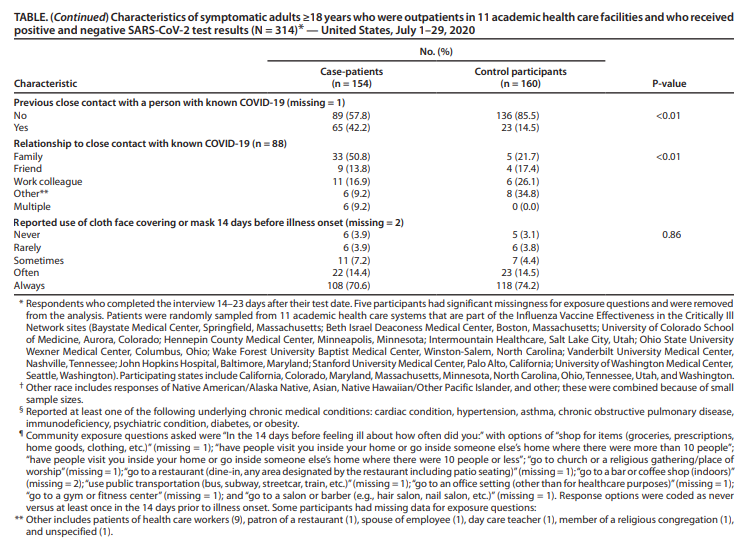
I've copied and pasted the pertinent numbers below.
Table Title: Characteristics of symptomatic adults ≥18 years who were outpatients in 11 academic health care facilities and who received positive and negative SARS-CoV-2 test results (N = 314)* — United States, July 1–29, 2020.
These are the figures for the 153* case patients who tested positive.
Patients Who Tested Positive
| Characteristic | Case Patients | Percentage |
|---|---|---|
| Never | 6 | 3.9% |
| Rarely | 6 | 3.9% |
| Sometimes | 11 | 7.2% |
| Often | 22 | 14.4% |
| Always | 108 | 70.6% |
| Total | 153 | 100.0% |
These are the figures for the 159* case patients who tested negative.
Patients Who Tested Negative
| Characteristic | Case Patients | Percentage |
|---|---|---|
| Never | 5 | 3.1% |
| Rarely | 6 | 3.8% |
| Sometimes | 7 | 4.4% |
| Often | 23 | 14.5% |
| Always | 118 | 74.2% |
| Total | 159 | 100.0% |
* In both tables, one person did not respond.
Going back to the positive table, if you add the group of case patients, adding the groups who often or always wore masks, there are 130 of them. Out of 153 who tested positive, that is 130/153 = 85% of them.
The same statistic, for those who didn't test positive, is (23+118)/159 = 141/159 = 89%.
That said, as a math major and former actuary, I can state unequivocally that this is a terrible misinterpretation. As I have said hundreds of times, correlation does not mean causation. Furthermore, it is ridiculous to claim that 85% of mask wearers "catch it." If 85% of Americans worse masks often or always and then 85% of them "catch it," then infection rates would be at least (85%)^2 = 72.55%. It would actually be higher from the cases of non-mask-wearers. As of this writing there are 8,617,022 cases (Source: CDC) and a US population of 328.2 million. That is 2.63% of the population. A far cry from 72.55%.
This is like taking the statistic that 74.2% of NBA players are African-American (source: statsta) and interpreting it as 74.2% of African Americans are NBA players.
If you don't follow my argument, the following video by KHOU news in Houston also explains the source of the 85% statistic.
This question is asked and discussed in my forum at Wizard of Vegas.
When will the national debt reach one quadrillion dollars?
First, let me remind my readers that a quadrillion is a million billion, or a thousand trillion.
First, let's look at the national debt now (November 1, 2020). According to The Balance, the national debit is currently $22.719 trillion and was $5.656 trillion in 1999.
Over that 20-year period, the debt has grown at a rate of 7.2% per year. At that rate, the debt will reach one quadrillion dollars in the year 2073.