


On this page
Card Counting in Baccarat
Introduction
For decades, I've been saying that for all intents and purposes, baccarat is a game of independent trials. In other words, studying the past outcomes in the shoe doesn't help. However, while studying the pattern of Banker and Player wins won't help you, counting cards will, a little.
To avoid confusion, when writing about baccarat, I will use all lower-case when referring to the one playing the game and capitalize Player when referring to the bet.
Effect of Removal
The start of any discussion of how card counting can improve your odds in a game like blackjack or baccarat, where multiple hands are played before shuffling, is in studying the effect of removal of any given card. For example, in blackjack it is good for the player when a five is removed and bad when an ace is removed. This is because fives tend to be bad for the player and aces good. That said, the following table shows the effect of removal of all ten point values on all three major bets. These figures are the increase in player expected value given one card removed from an eight-deck shoe, multiplied by ten million.
Effect of Removal
| Card | Player | Banker | Tie |
|---|---|---|---|
| 0 | 188 | -178 | 5129 |
| 1 | 440 | -448 | 1293 |
| 2 | 522 | -543 | -2392 |
| 3 | 649 | -672 | -2141 |
| 4 | 1157 | -1195 | -2924 |
| 5 | -827 | 841 | -2644 |
| 6 | -1132 | 1128 | -11595 |
| 7 | -827 | 817 | -10914 |
| 8 | -502 | 533 | 6543 |
| 9 | -231 | 249 | 4260 |
For more on how this table was developed, please see my baccarat appendix 2.
Looking at this from the perspective of the Player bet, a deck rich in high cards is good. That is why it is bad for the Player bet when they leave the deck. The flip side of that coin is a deck rich in low cards is good for the Banker bet. Thus, if a low card leaves the shoe, that improves the odds on the Player and if a high card leaves, it's good for the Banker.
Running Count
To keep this method simple, I devised a simple plus-minus strategy for levels 1 and 2. To use it, follow these instructions.
- At the start of a new shoe, set the Running Count equal to 0.
- As cards are exposed, add the following values according to each card seen.
- 1 to 4 points = +1
- 5 to 8 points = -1
- 0 and 9 points = 0
- You will bet on the Player or Banker according to the Running Count as you play. This is explained further according to whether playing the Level 1 or Level 2 strategy (see below).
The following table shows the expected value (EV) of the Player and Banker bets by the running count for counts of -25 to +25.
Expected Values by Running count
| Running Count |
Probability | Player EV |
Banker EV |
|---|---|---|---|
| -25 | 0.01% | -0.83% | -1.46% |
| -24 | 0.02% | -0.81% | -1.47% |
| -23 | 0.03% | -0.76% | -1.52% |
| -22 | 0.05% | -0.83% | -1.45% |
| -21 | 0.07% | -0.85% | -1.44% |
| -20 | 0.10% | -0.89% | -1.40% |
| -19 | 0.15% | -0.87% | -1.42% |
| -18 | 0.20% | -0.88% | -1.41% |
| -17 | 0.28% | -0.91% | -1.37% |
| -16 | 0.38% | -0.92% | -1.36% |
| -15 | 0.51% | -0.94% | -1.35% |
| -14 | 0.67% | -0.95% | -1.34% |
| -13 | 0.87% | -0.98% | -1.31% |
| -12 | 1.11% | -0.98% | -1.31% |
| -11 | 1.40% | -1.01% | -1.28% |
| -10 | 1.75% | -1.01% | -1.28% |
| -9 | 2.15% | -1.03% | -1.26% |
| -8 | 2.61% | -1.05% | -1.23% |
| -7 | 3.13% | -1.07% | -1.22% |
| -6 | 3.68% | -1.09% | -1.20% |
| -5 | 4.27% | -1.12% | -1.17% |
| -4 | 4.88% | -1.14% | -1.15% |
| -3 | 5.47% | -1.17% | -1.13% |
| -2 | 6.03% | -1.19% | -1.10% |
| -1 | 6.42% | -1.21% | -1.08% |
| 0 | 7.81% | -1.24% | -1.05% |
| 1 | 6.40% | -1.26% | -1.03% |
| 2 | 5.97% | -1.29% | -1.01% |
| 3 | 5.43% | -1.32% | -0.98% |
| 4 | 4.84% | -1.33% | -0.97% |
| 5 | 4.24% | -1.36% | -0.94% |
| 6 | 3.65% | -1.38% | -0.92% |
| 7 | 3.10% | -1.39% | -0.90% |
| 8 | 2.59% | -1.41% | -0.88% |
| 9 | 2.14% | -1.42% | -0.88% |
| 10 | 1.73% | -1.44% | -0.86% |
| 11 | 1.39% | -1.45% | -0.84% |
| 12 | 1.10% | -1.47% | -0.83% |
| 13 | 0.86% | -1.49% | -0.81% |
| 14 | 0.66% | -1.50% | -0.80% |
| 15 | 0.50% | -1.51% | -0.79% |
| 16 | 0.37% | -1.53% | -0.76% |
| 17 | 0.28% | -1.53% | -0.77% |
| 18 | 0.20% | -1.55% | -0.75% |
| 19 | 0.14% | -1.59% | -0.71% |
| 20 | 0.10% | -1.57% | -0.72% |
| 21 | 0.07% | -1.55% | -0.75% |
| 22 | 0.05% | -1.59% | -0.71% |
| 23 | 0.03% | -1.65% | -0.65% |
| 24 | 0.02% | -1.55% | -0.75% |
| 25 | 0.01% | -1.76% | -0.55% |
The table above shows the best bet is on the Player for running counts of -4 or less and on the Banker otherwise.
Level 1 Strategy
The use the Level 1 strategy, simply bet on the Player if the Running Count is -4 or less. Otherwise, bet the Banker.
Given this strategy, the player will bet on the Player 28.4% of the time. The following table shows the result of these Player bets. The bottom right corner shows a house edge of 1.06%. This should be compared to the house edge of 1.24% on the Player bet when not counting.
Level 1 Player Bets
| Event | Pays | Probability | Return |
|---|---|---|---|
| Win | 1 | 0.447281 | 0.447281 |
| Push | 0 | 0.094824 | 0.000000 |
| Loss | -1 | 0.457895 | -0.457895 |
| Total | 1.000000 | -0.010614 |
The following table shows the result of the 71.6% of the time the player will bet on the Banker. The bottom right corner shows a house edge of 0.99%. This should be compared to the house edge of 1.06% on the Banker bet when not counting.
Level 1 Banker Bets
| Event | Pays | Probability | Return |
|---|---|---|---|
| Win | 0.95 | 0.458875 | 0.435932 |
| Push | 0 | 0.095281 | 0.000000 |
| Loss | -1 | 0.445844 | -0.445844 |
| Total | 1.000000 | -0.009912 |
The next table summarizes the two tables above by showing the possible outcomes across both Player and Banker bets. The lower right cell shows a combined house edge of 1.01%. This should be compared to the house edge of 1.06% of betting the Banker bet only or 1.11% of betting both in the same ratio of 28.4% Player bets and 71.6% Banker bets.
Level 1 Combined Return Table
| Bet | Winning Side | Pays | Probability | Return |
|---|---|---|---|---|
| Player | Player | 1 | 0.126836 | 0.126836 |
| Player | Tie | 0 | 0.026889 | 0.000000 |
| Player | Banker | -1 | 0.129846 | -0.129846 |
| Banker | Player | 0.95 | 0.328751 | 0.312314 |
| Banker | Tie | 0 | 0.068262 | 0.000000 |
| Banker | Banker | -1 | 0.319415 | -0.319415 |
| Total | 1.000000 | -0.010111 |
The table on the expected value of both bets by count shows they are closest at -4. The further away from -4 the count is, the greater the better of the two bets. That said, the player can decrease the house edge by not playing when the count is close to -4.
The following table shows the ratio of hands played and house edge according to what range of true counts are skipped by not betting. For example, if the player sits out when the true count is -8 to 0, then he will play 55.69% of hands and those hand he does play will have an average house edge of 0.95%.
Skipping Bad Counts
| Counts Skipped |
Ratio Hands Played |
Hosue Edge |
|---|---|---|
| None | 100.00% | 1.01% |
| -4 | 95.12% | 1.00% |
| -5 to -3 | 85.37% | 0.99% |
| -6 to -2 | 75.66% | 0.98% |
| -7 to -1 | 66.11% | 0.96% |
| -8 to 0 | 55.69% | 0.95% |
| -9 to +1 | 47.13% | 0.93% |
The player might also consider betting more the further away the running count gets from -4.
Level 2
To cut an additional 0.01% off the house edge, for the player who wants to bet every hand, he can use this Level 2 strategy.
The only difference between the Level 1 and Level 2 is that the point at which the running count is low enough to bet on the Player changes as the game progresses through the shoe. This reason is any given count is more diluted early in the shoe, because there are so many more cards to be played.
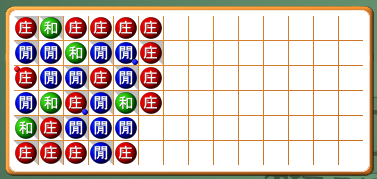
The "index point" at which the player should bet the Player will depend on the column in the Bead Plate the player is currently on. The Bead Plate is the table on the score board that shows the history of Player and Banker wins. For example, in the following image, taken from my baccarat trainer, the player is in the sixth column.
To be specific, the following table shows the index point for each column in the Bead Plate. The player should bet the Player, if the running count is equal or less than the index value.
Level 2 Index Values
| Column | Index Value |
|---|---|
| 1 | -15 |
| 2 | -14 |
| 3 | -13 |
| 4 | -12 |
| 5 | -11 |
| 6 | -10 |
| 7 | -9 |
| 8 | -8 |
| 9 | -7 |
| 10 | -6 |
| 11 | -5 |
| 12 | -4 |
| 13 | -3 |
| 14 | -2 |
| 15 | -1 |
The following table shows the results of a level 2 simulation on Player bets, which are made 18.3% of the time, only. The lower right cell shows a house edge of 0.99%.
Level 1 Player Bets
| Event | Pays | Probability | Return |
|---|---|---|---|
| Win | 1 | 0.447709 | 0.447709 |
| Loss | -1 | 0.457639 | -0.457639 |
| Tie | 0 | 0.094651 | 0.000000 |
| Total | 1.000000 | -0.009930 |
The following table shows the results of a level 2 simulation on Banker bets, which are made 81.7% of the time, only. The lower right cell shows a house edge of 1.01%.
Level 2 Banker Bets
| Card | Player | Banker | Tie |
|---|---|---|---|
| Win | 0.95 | 0.458810 | 0.435870 |
| Loss | -1 | 0.445926 | -0.445926 |
| Tie | 0 | 0.095264 | 0.000000 |
| Total | 1.000000 | -0.010056 |
The following table shows the combined results of both Player and Banker bets playing the level 2 strategy. The lower right cell shows a house edge of 1.00%.
Level 2 Combined Return Table
| Event | Pays | Probability | Return |
|---|---|---|---|
| Winning player bet | 1 | 0.081815 | 0.081815 |
| Winning banker bet | 0.95 | 0.374967 | 0.356219 |
| Tie | 0 | 0.095152 | 0.000000 |
| Loss | -1 | 0.448066 | -0.448066 |
| Total | 1.000000 | -0.010033 |
All things considered, a reduction in 0.01% only is probably not worth the fuss for most people, compared to the level 1 strategy. However, as long as I did all the analysis, I may as well write about it.
Level 3
Level 3 is an adaptation of Level 1, where the only thing that guides the decision of the side to bet on is the running count. The position in the shoe or column in the bead plate does not matter. Where level 3 takes things to a new level is the point value of each card, which is more proportional to it's effect on the odds. The following table shows how to adjust the running count by each card observed.
Level 3 Points per Rank
| Rank | Points |
|---|---|
| 0 | 1 |
| 1 | 2 |
| 2 | 3 |
| 3 | 3 |
| 4 | 6 |
| 5 | -4 |
| 6 | -6 |
| 7 | -4 |
| 8 | -3 |
| 9 | -1 |
As with the level 1 strategy, start the shoe with a running count of 0 and add the point value of each rank as cards are revealed.
Unlike the level 1 strategy, the player should bet the Player with a running count of -15 or less.
Given this strategy, the player will bet on the Player 28.55% of the time. The following table shows the result of these Player bets. The bottom right corner shows a house edge of 1.05%. This should be compared to the house edge of 1.24% on the Player bet when not counting.
Level 3 Player Bets
| Event | Pays | Probability | Return |
|---|---|---|---|
| Win | 1 | 0.447480 | 0.447480 |
| Push | 0 | 0.094542 | 0.000000 |
| Loss | -1 | 0.457978 | -0.457978 |
| Total | 1.000000 | -0.010498 |
The following table shows the result of the 71.6% of the time the player will bet on the Banker. The bottom right corner shows a house edge of 0.99%. This should be compared to the house edge of 1.06% on the Banker bet when not counting.
Level 3 Banker Bets
| Event | Pays | Probability | Return |
|---|---|---|---|
| Win | 0.95 | 0.458844 | 0.435902 |
| Push | 0 | 0.095395 | 0.000000 |
| Loss | -1 | 0.445760 | -0.445760 |
| Total | 1.000000 | -0.009858 |
The next table summarizes the two tables above by showing the possible outcomes across both Player and Banker bets. The lower right cell shows a combined house edge of 1.004%. This should be compared to the house edge of 1.06% of betting the Banker bet only or 1.11% of betting both in the same ratio of 28.4% Player bets and 71.6% Banker bets. As a reminder, the overall house edge betting ever hand using the level 1 strategy is 1.011%, 0.007% higher.
Level 1 Combined Return Table
| Bet | Winning Side | Pays | Probability | Return |
|---|---|---|---|---|
| Player | Player | 1 | 0.127764 | 0.127764 |
| Player | Tie | 0 | 0.026994 | 0.000000 |
| Player | Banker | -1 | 0.130761 | -0.130761 |
| Banker | Player | 0.95 | 0.327836 | 0.311444 |
| Banker | Tie | 0 | 0.068158 | 0.000000 |
| Banker | Banker | -1 | 0.318487 | -0.318487 |
| Total | 1.000000 | -0.010041 |
As with the level 1 strategy, the player can reduce the overall house edge by skipping hands that are close to the point where both bets are about equally as bad. In this case, that point is a running count of -14.
The following table shows the ratio of hands played and house edge according to what range of true counts are skipped by not betting. For example, if the player sits out when the true count is -8 to 0, then he will play 55.69% of hands and those hand he does play will have an average house edge of 0.95%.
Skipping Bad Counts
| Counts Skipped |
Ratio Hands Played |
Hosue Edge |
|---|---|---|
| None | 100.00% | -1.00% |
| -10 to -20 | 86.55% | -0.98% |
| -5 to -25 | 74.42% | -0.97% |
| 0 to -30 | 61.46% | -0.95% |
| +5 to -35 | 50.52% | -0.93% |
All things considered, the reduction in house edge compared to level 1 is only 0.01% using level 3. Probably not worth the bother for most players.
Conclusion
As mentioned in the introduction, card counting can indeed be used to cut down the house edge in baccarat. In my opinion, level 1 will be appropriate for most people. Level 2 and 3 offer a reduction in house edge of about 0.01%, which I don't think is worth the bother.
External Links
Discussion about this topic in my forum at Wizard of Vegas.