


On this page
Keno Props
Introduction
Following are some miscellaneous keno probabilities. You may find them useful to challenge your friends to some keno props the next time you're in a restaurant with a keno board. First, let me define some terms.
- Row: A straight line going side to side, for example the numbers 21 to 30.
- Column: A straight line going up and down, for example that covering the numbers 3, 13, 23, 33, 43, 53, 63, and 73.
- Density: The probability that the total marks will be a specified number exactly.
- Distribution: The probability that the total marks will be a specified number or less.
Maximum Number of Marks in a Row
| Marks | Density | Distribution |
|---|---|---|
| 3 | 0.04527897 | 0.04527897 |
| 4 | 0.48940972 | 0.53468869 |
| 5 | 0.36052029 | 0.89520898 |
| 6 | 0.09077479 | 0.98598377 |
| 7 | 0.01288264 | 0.99886641 |
| 8 | 0.00108385 | 0.99995027 |
| 9 | 0.0000488 | 0.99999907 |
| 10 | 0.00000093 | 1 |
Maximum Number of Marks in a Column
| Marks | Density | Distribution |
|---|---|---|
| 2 | 0.00008424 | 0.00008424 |
| 3 | 0.24679217 | 0.24687642 |
| 4 | 0.55201679 | 0.79889321 |
| 5 | 0.17583628 | 0.97472949 |
| 6 | 0.02362016 | 0.99834965 |
| 7 | 0.00160675 | 0.9999564 |
| 8 | 0.0000436 | 1 |
Total Empty Rows
| Marks | Density | Distribution |
|---|---|---|
| 0 | 0.66614523 | 0.66614523 |
| 1 | 0.30214711 | 0.96829234 |
| 2 | 0.03096811 | 0.99926045 |
| 3 | 0.00073693 | 0.99999739 |
| 4 | 0.00000261 | 1 |
| 5 | 0 | 1 |
| 6 | 0 | 1 |
| 7 | 0 | 1 |
| 8 | 0 | 1 |
Total Empty Columns
| Marks | Density | Distribution |
|---|---|---|
| 0 | 0.34140772 | 0.34140772 |
| 1 | 0.45924256 | 0.80065028 |
| 2 | 0.17561107 | 0.97626135 |
| 3 | 0.02278398 | 0.99904534 |
| 4 | 0.00094499 | 0.99999033 |
| 5 | 0.00000966 | 0.99999999 |
| 6 | 0.00000001 | 1 |
| 7 | 0 | 1 |
| 8 | 0 | 1 |
| 9 | 0 | 1 |
| 10 | 0 | 1 |
Maximum Marks in Top or Bottom
| Marks | Density | Distribution |
|---|---|---|
| 10 | 0.20324741 | 0.20324741 |
| 11 | 0.35762212 | 0.56086953 |
| 12 | 0.24306014 | 0.80392966 |
| 13 | 0.12690566 | 0.93083532 |
| 14 | 0.05038823 | 0.98122356 |
| 15 | 0.01497834 | 0.9962019 |
| 16 | 0.00325002 | 0.99945191 |
| 17 | 0.00049553 | 0.99994744 |
| 18 | 0.0000496 | 0.99999704 |
| 19 | 0.00000287 | 0.99999992 |
| 20 | 0.00000008 | 1 |
The next table is for the maximum number of marks that can be contained in any three rows, columns, or any combination of rows and columns. For example the image below shows the most marks in any three columns is 13. There are various ways this could be done, just one of which is circled.
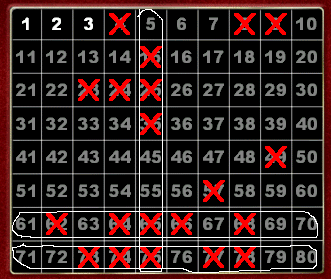
Image courtesy of the
See why we recommend Bodog.
Maximum Marks in Three Rows and/or Columns
| Marks | Density | Distribution |
|---|---|---|
| 0 | 0 | 0 |
| 1 | 0 | 0 |
| 2 | 0 | 0 |
| 3 | 0 | 0 |
| 4 | 0 | 0 |
| 5 | 0 | 0 |
| 6 | 0 | 0 |
| 7 | 0 | 0 |
| 8 | 0 | 0 |
| 9 | 0.01002066 | 0.01002066 |
| 10 | 0.12038178 | 0.13040245 |
| 11 | 0.33280855 | 0.46321099 |
| 12 | 0.33627509 | 0.79948608 |
| 13 | 0.1542072 | 0.95369328 |
| 14 | 0.03941847 | 0.99311175 |
| 15 | 0.00619848 | 0.99931023 |
| 16 | 0.00064619 | 0.99995642 |
| 17 | 0.00004259 | 0.99999902 |
| 18 | 0.00000098 | 1 |
| 19 | 0 | 1 |
| 20 | 0 | 1 |
Next are some even money bets to challenge your friends with. The side listed is the good side. The house edge is how much that side can expect to lose.
Even Money Keno Props
| Prop | Probability of a Win |
House Edge |
|---|---|---|
| No row will have 5 or more hits | 53.47% | 6.94% |
| Greatest number of hits in a column will be exactly 4 | 55.2% | 10.4% |
| Every row to have at least one mark | 66.61% | 33.23% |
| Number of empty columns will not be 1 | 54.08% | 8.15% |
| Top/bottom to have 9 to 11 marks | 56.09% | 12.17% |
| 3 lines (rows and/or columns) will contain 12 or more marks | 53.68% | 7.36% |
Methodology: The tables above were created by random simulation of at least 500 million games.