


Probability - Coins
If a coin was flipped 1000 times what is the probability the total number of heads would fall in the range of 452 to 548?
For this problem we can use the normal approximation to the binomial distribution. The variance of the number of heads is 1000*(1/2)*(1/2)=250. So the standard deviation is 2501/2=15.8114. The probability of less than 548 heads is normdist((548+0.5-500)/15.8114) = 0.998920, where normsdist is the Excel function for the probability a random variable with a normal distribution of mean 0 and standard deviation 1 will fall under the given Z score. Next we subtract the probability of less than 452 heads. This is normdist((452-0.5-500)/15.8114) = 0.001080. So the answer is 0.99892-0.00108 = 0.997840. Again, this is an approximation. The actual answer is 0.997856, but is more tedious to derive. On average, after establishing a point in craps how often will the player make the point?
Given that a point was made 5/12 of the time it will be a 6 or 8, 4/12 a 5 or 9, and 3/12 a 4 or 10. The probability of making a 6 or 8 is 5/11, a 5 or 9 is 4/10, and a 4 or 10 is 3/9. So the probability of making a point, given that a point was established is, (5/12)*(5/11)+(4/12)*(4/10)+(3/12)*(3/9) = 40.61%.
Mr. Wizard, if 50 different people toss a coin in the air 8 different times. What percentage of the 50 people will toss 8 consecutive heads or tails? Thanking you in advance.
The probability of any given person tossing 8 heads or tails is 2*(1/2)8 = 1 in 128. If 50 people did this on average 0.39 of them will get all heads or tails. The probability of at least one person getting all heads or tails is 32.44%.
I have a bag of 100 coins, one of those coins is a two-headed coin. I randomly pick a coin and then I observe the coin flipping 10 heads in a row. What is the probability that I picked the two-headed coin?
This is a textbook Bayesian conditional probability question. In general the probability of A given B is the probability of A and B divided by the probability of B. In this case A is flipping 10 heads in a row and B is picking the two-headed coin. The probability of A and B is 1/100. This is because there is a 1 in 100 chance of picking the two-headed coin, and if you do the probability is 100% of flipping 10 heads in a row. The probability of flipping 10 heads in a row, assuming a randomly picked coin, is (1/100)*1 + (99/100)*(1/2)10. That is because there is a 1% chance of picking the two-headed coin, which has a 100% of getting 10 heads, and a 99% of picking a fair coin, which has a (1/2)10 chance of flipping 10 heads in a row. So, the probability that you picked the 2-headed coin, given that you flipped 10 heads in a row, is 0.01/(0.01*1 + 0.99* 0.000977) = 0.911843.
Do you have any advice for betting on the flip of a coin?
Yes! My advice is bet on the face up side at the start of the flip. According to Science News Online the probability that a coin will land on the same side it started on is 51%. The article says the reason is because a flipped coin does not spin perfectly around its axis and sometimes appears to be flipping when it actually isn’t. The hypothesis only applies if coin is caught in the palm of the hand, so that bouncing is not an issue. The article also says that a spinning penny will land on tails 80% of the time, due to the heavier head side gravitating towards falling down first. However I’m skeptical of this. I tried this 20 times and got 11 heads and 9 tails. The probability of getting 9 or fewer tails in 20 spins with a probability of success of 80% is 1 in 1775.
I believe I may have an answer to the spinning penny. Over a decade ago I did a science project about penny spinning in sixth grade. I read in Omni magazine that spinning a penny very fast will nearly always stop tails up because the sides slope towards heads. I tried it hundreds of times and gotten nearly unbiased results, except twice when it stood on its edge.
After numerous hours wasted I finally found that I was spinning it too fast, and a slower spin gave me the results desired, that is tails up. Also the penny isn’t completely even and starting the spin on the thinnest part seemed to add to the consistency. A few charts full of bs and a giant cardboard circle decorated like a penny got me an A for Science and failing marks for every other class as I ignored all my homework.
So I’ve proven conclusively with one crudely done experiment done over ten years ago that I barely remember anything about and had no real understanding what I was doing at the time, that you perhaps maybe might just be spinning your penny a tad little too fast.
Alright, I tried this again spinning the penny slowly 100 times. By slowly I mean the time between flicking and when the outcome was obvious was at least two seconds but less than five. I used a nice shiny 2004-D penny. My results were 52 heads and 48 tails. So I still remain unconvinced a spinning penny at any speed is highly biased towards tails.
My understanding of "wait time" for an event is the reciprocal of the probability of that event. I’m interested in calculating the wait time to roll consecutive 2s using one die. In a simulation I get 42 rolls on average. How do I make the connection with the probability of rolling consecutive 2s?
It is true that for single events if the probability is p then the average wait time is 1/p. However it gets more complicated with consecutive events. Let x be the state that the last roll was not a two. This is also the state at the beginning. Let y be the state that the last roll was a two. After the first roll there is a 5/6 chance we will still be in state x, and 1/6 chance we will be in state y. Let Ex(x) be the expected number of rolls from state x, and Ex(y) the expected number from state y. Then...
Ex(x) = 1 + (5/6)*ex(x) + (1/6)*ex(y), and
Ex(y) = 1 + (5/6)*ex(x)
Solving for these two equations...
Ex(x) = 1 + (5/6)*ex(x) + (1/6)*( 1 + (5/6)*Ex(x))
Ex(x) = 7/6 + (35/36)*Ex(x)
(1/36)*Ex(x) = 7/6
Ex(x) = 36*(7/6) = 42
So the average wait time for two consecutive twos is 42 rolls.
I have the same type of problem, only the expected flips to get two heads, in my site of math problems, see problem 128.
Suppose we have a gambling game. An unbiased coin flipped repeatedly. For each flip, we have to pay 1 rupee. There are two possible outcomes H or T. If the difference between head tossed and tail tossed becomes 3, we will get 8 rupee from the gambler. Should we play the game, and why? How much is our probability of winning? What should be impact on probability of winning when we are getting 7 or 9 rupees?
Lets call x the expected number of flips from the starting point.
Lets call y the expected number of remaining flips if one side is one flip in the majority.
Lets call z the expected number of remaining flips if one side is two flips in the majority.
E(x) = 1 + E(y)
E(y) = 1 + 0.5*E(x) + 0.5*E(z)
E(z) = 1 + 0.5*E(y)
It is then easy matrix algebra to see that E(x) = 9, E(y) = 8, and E(z) = 5. So on average it will take 9 flips for the disparity between heads and tails to be 3. So at 8 rupees it is a good bet for the person collecting the one rupee per flip, because he will receive on average 9 rupees, but pay back only 8. The house edge for the gambler is 11.11%. At 9 rupees it is a fair bet, at 7 the house advantage is 22.22%.
In your March 13, 2006 Ask the Wizard, you gave three formulae for the "rupee" game. While the solution is mathematically right, I can’t for the life of me understand how the three equations model the problem. Can you give any insight on how you came up with the three equations?
I had a number of people ask me to expand on my answer. The solution requires basic matrix algebra.
Start by defining x as the answer, or the average number of flips until the disparity between heads and tails is 3.
Let y be the expected number of flips from a point where one side is up by one flip.
Let z be the expected number of flips from a point where one side is up by two flips.
After the first flip one side will be in the majority by one flip. So x=1+y.
When either side is one flip ahead another flip will result in either the initial tied state, or one side being up by two flips. Both outcomes are equally likely. So y=1+0.5*x + 0.5*z
When either side is two flips ahead another flip will result in either one side being up by one flip, or the end of the game. Again, both outcomes are equally likely. So z=1+0.5*y
So we have three equations and three unknowns:
(1) X= 1+y
(2) Y = 1+ 0.5x + 0.5z
(3) Z = 1+ 0.5y
To solve lets first get rid of the decimals by multiplying the last two equations by 2.
(1) X= 1+y
(2) 2Y = 2+ x + z
(3) 2Z = 2+ y
Let’s substitute 1+y, from (1) for x in (2).
2Y = 2 + 1 + y + z
(4) y = 3 + z
No substitute 3+z for y in (3)
2z = 2 + 3 + z
z = 5
Now substitute 5 for z in (4) to get
(5) y = 3+ 5 = 8
No substitute y = 8 in (1) to get
(6) x = 9
A friend chooses a 3-flip sequence of heads or tails, and gives me the option to choose my own (different) 3-flip sequence. We flip a fair coin as many times as necessary until one of our sequences comes up. If he picks H-H-H, which sequence should I pick, and what is my advantage on this bet? How do I calculate which sequence to pick based on his chosen sequence?
The following table shows the probability of player A winning according to all possible chosen patterns of player A and player B.
Probability of Player A Winning
| Player A | Player B | |||||||
| HHH | HHT | HTH | HTT | THH | THT | TTH | TTT | |
| HHH | 1/2 | 2/5 | 2/5 | 1/8 | 5/12 | 3/10 | 1/2 | |
| HHT | 1/2 | 2/3 | 2/3 | 1/4 | 5/8 | 1/2 | 7/10 | |
| HTH | 3/5 | 1/3 | 1/2 | 1/2 | 1/2 | 3/8 | 7/12 | |
| HTT | 3/5 | 1/3 | 1/2 | 1/2 | 1/2 | 3/4 | 7/8 | |
| THH | 7/8 | 3/4 | 1/2 | 1/2 | 1/2 | 1/3 | 3/5 | |
| THT | 7/12 | 3/8 | 1/2 | 1/2 | 1/2 | 1/3 | 3/5 | |
| TTH | 7/10 | 1/2 | 5/8 | 1/4 | 2/3 | 2/3 | 1/2 | |
| TTT | 1/2 | 3/10 | 5/12 | 1/8 | 2/5 | 2/5 | 1/2 | |
A memory device to select the optimal pattern is his first and second picks should be your second and third respectively. Your first pick should be the opposite of your third. For example if your opponent chooses HTT your second and third picks should be HT. Your last pick is T so your first should be H, for an HHT pattern. Following this strategy your probability of winning will be 2/3 to 7/8, depending on what pattern your opponent picks.
Hello, my name is Patty. You have a very nice site and you seem like a very knowledgeable man. Definelty the kind of man I want by my side in a Casino!!!!!!! I was wondering if you could help me. I told my boy friend that I would look for an answer to a problem on the internet. If you were to help me, it would really make me look good.
My boy friend is a coin collector. He bought a bag of wheat pennies. I don’t know much about coins myself. (He is teaching me as time goes by) But he said that he was amazed that one certain year wasn’t represented in the bag because they are so common. He said the odds of that happening had to be a billion to one. I told him I would try to ask people in my office (the self proclaimed geniuses!!) and if they didn’t know, I would try to do a little research online. I came across you.
Anyway if you can help. I would greatly appreciate it. The bag had approximately 5,500 pennies. The total amount of wheat pennies minted by all the US mints was 24,267,000,000 The number of 1955’s that were minted (The one he was looking for) was 330,000,000. Some of the guys in my office say that there are other factors like; demographics, the fact that the MInts may not have distributed all the pennies etc. ...................... I would assume that they are correct but, I (and I’m sure my boy friend also) would settle on knowing the approximant odds!!!!!!!!! I hope you can help.
Your mintage numbers are close to those of Mountain View Coins. Assuming that every wheat penny ever minted has the same probability of being in the bag the probability of any one penny not being a 55 is (24,267,000,000-330,000,000)/24,267,000,000 = 0.986401286. The probability of 5500 coins not being a 55 can be very closely approximated as 0.9864012865500 = 1 in 507,033,772,284,213,000,000,000,000,000,000.
My father is a coin collector so I asked him for help on this one. Here is what he said,
Here is my guess. In the year 1955, there were a small number of Lincoln cents struck in Philadelphia with the date struck twice. no one knows exactly how many They were mixed with other cents for circulation before the error was discovered. An uncirculated specimen today is worth about $2000.to $6000. I suspect that the bag of "wheats" had already been culled of all of its 1955’s by someone looking for double-die specimens. Here is a picture of one: 1955 Doubled Die Obverse One Cent.
Note that this website is selling "wheats" and you can bet that some culling of dates has already occurred after the coins were collected by the dealer. I would have thought that the 1955’s that were not double-die would have been returned to the collection, but perhaps they are sold separately, or melted down. The copper in wheat pennies is worth much more than one cent today. That is why they switched to copper-plated zinc cents a few decades ago. There is a possibility that the mint itself decided not to distribute many of the 1955’s, and melted them down after minting to avoid a frantic scramble for the rare double-die specimens. The mint and Post Office has always been embarrassed by printing errors, and tries to keep them out of circulation
In your last column you said that "The probability of 5500 coins not being a 55 can be very closely approximated as 0.9864012865500 = 1 in 507,033,772,284,213,000,000,000,000,000,000."
I assume "approximated" because of the effect of removal as you go through the 5500 coins. Talk about a minuscule effect of removal! This is a good example of the target coins becoming LESS likely as you remove non-targets, because the effect of removal is so small compared to the much larger probability of a crooked game, i.e. the target coins have been removed.
Yes, I said “closely approximated” because there are only so many pennies in the world. Remove one non-55 from the bag and the effect of removal increases the probability that every other penny in the bag is a 55. If I hadn’t said “closely approximated” at least three people would have written in to correct me. It is of course an extremely minute effect, but many of my readers are perfectionists, and will jump all over me for the slightest of errors.
There are two tables in a room. On the one to the right there are a 100 coins, 20 with H facing up and the rest (80) with the T side facing up. There are no coins on the other table. The goal is to somehow move the coins so that there will be an equal number of coins with H facing up, on both tables. You cannot see the coins (dark room) or touch them to tell if they’re facing "up" or "down".
Go to my other site, mathproblems.info for the solution (spoiler warning!)
My friend offered to bet me $20.00 and give me 3 to 1 odds that if I flipped a coin 100 times, it would have come up exactly 50 heads and 50 tails. If it did, I would win $60.00 and if it didn’t, I would owe him $20.00. Should I have taken the bet? Also, if 50/50 is not the most likely outcome, is there another outcome (like 51/49) that is more likely to occur?
The probability of getting exactly 50 of each is combin(100,50)*(1/2)100 = 7.96%. Fair odds would be 11.56 to 1. So, at 3 to 1, it is a terrible bet, with a house edge of 68.2%. That is some friend you have. 50/50 is the most likely exact split between heads and tails. An interesting bet is whether the number of heads/tails will fall between 47 and 53, or not. The probability of falling inside that range is 51.59%. If you can find someone to bet that the total will fall outside that range, then at even money you would have a 3.18% advantage.
The following table shows the probability for each of 30 to 70 heads/tails.
Probability of Total Heads/Tails in 100 Flips
| Heads/Tails | Probability |
|---|---|
| 30, 70 | 0.000023 |
| 31, 69 | 0.000052 |
| 32, 68 | 0.000113 |
| 33, 67 | 0.000232 |
| 34, 66 | 0.000458 |
| 35, 65 | 0.000864 |
| 36, 64 | 0.001560 |
| 37, 63 | 0.002698 |
| 38, 62 | 0.004473 |
| 39, 61 | 0.007111 |
| 40, 60 | 0.010844 |
| 41, 59 | 0.015869 |
| 42, 58 | 0.022292 |
| 43, 57 | 0.030069 |
| 44, 56 | 0.038953 |
| 45, 55 | 0.048474 |
| 46, 54 | 0.057958 |
| 47, 53 | 0.066590 |
| 48, 52 | 0.073527 |
| 49, 51 | 0.078029 |
| 50 | 0.079589 |
The general formula for the probability of w wins out of n trials, where the probability of each win is p, is combin(n,w) × pw × (1-p)(n-w) = [n!/(w! × (n-w)!] × pw × (1-p)(n-w).
If I flip a coin 1,000 times, what is the probability that I will see a streak of at least 10 heads or tails in a row?
Funny you should ask; another reader just sent me an academic paper on this topic. This paper includes the following graph, which shows the probability to be about 62%.
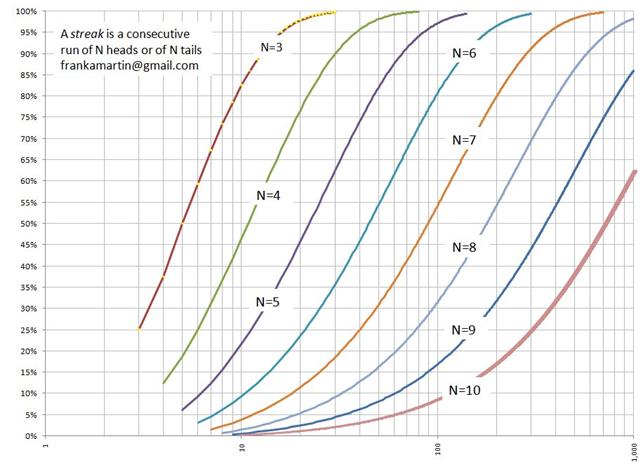
For more on this topic, please visit What were the Odds of Having Such a Terrible Streak at the Casino? (483K) by Frank Martin.
If a coin is flipped 100 times, what is the probability of getting a streak of at least 7 heads in a row at least once?
If there is an easy, non-recursive, expression for the answer, I’m not aware of it. However, there is an easy recursive answer.
f(n)= pr(tails in first flip)×f(n-1) +
pr(heads in first flip, tails in second flip)×f(n-2) +
pr(heads in first 2 flips, tails in third flip)×f(n-3) +
pr(heads in first 3 flips, tails in third flip)×f(n-4) +
pr(heads in first 4 flips, tails in fourth flip)×f(n-5) +
pr(heads in first 5 flips, tails in fifth flip)×f(n-6) +
pr(heads in first 6 flips, tails in sixth flip)×f(n-7) +
pr(heads in first 7 flips) =
(1/2)×f(n-1) +
(1/2)2×f(n-2) +
(1/2)3×f(n-3) +
(1/2)4×f(n-4) +
(1/2)5×f(n-5) +
(1/2)6×f(n-6) +
(1/2)7×f(n-7) +
(1/2)7
Where:
f(n)=probability of success within n flips.
pr(x)=probability of x happening.
Spreadsheets are perfect for problems like this. In the screenshots of the spreadsheet below, I put in a probability of 0 for cells B2 to B8, because you can’t have 7 heads in a row in 6 or fewer flips. For cell B9, I put in the formula:
=(1/2)*B8+(1/2)^2*B7+(1/2)^3*B6+(1/2)^4*B5+(1/2)^5*B4+(1/2)^6*B3+(1/2)^7*B2+(1/2)^7
Then I copied and pasted it from cells B10 to cell B102, which corresponds to 100 flips. That probability is 0.317520. A random simulation confirms it.
 |  |
After this originally published, Rick Percy shared his matrix algebra solution with me. Here it is in my own words. I assume the reader knows the basics of matrix albegra already.
First, there are eight possible states the flipper can be in at any one point:
p1 = Probability of success, given that you need 7 more heads from the current point.
p2 = Probability of success, given that you need 6 more heads from the current point.
p3 = Probability of success, given that you need 5 more heads from the current point.
p4 = Probability of success, given that you need 4 more heads from the current point.
p5 = Probability of success, given that you need 3 more heads from the current point.
p6 = Probability of success, given that you need 2 more heads from the current point.
p7 = Probability of success, given that you need 1 more heads from the current point.
p8 = Probability of success, given that you don’t need any more heads = 1.
Let’s define the maxtrix Sn as the probability of being in each state after the nth flip. S0 represents the probabilities before the first flip, where there is a 100% chance of being in state 0. So S0 =
| 1 0 0 0 0 0 0 0 |
Let T be the transformation matrix from two consecutive flips, or Sn to Sn+1, where Sn+1 = T × Sn
- If you’re in state 1 then after one flip you have a 0.5 chance of being in state 2 (with a heads), and 0.5 of remaining at state 1 (with a tails).
- If you’re in state 2 then after one flip you have a 0.5 chance of being in state 3 (with a heads), and 0.5 of returning to state 1 (with a tails).
- If you’re in state 3 then after one flip you have a 0.5 chance of being in state 4 (with a heads), and 0.5 of returning to state 1 (with a tails).
- If you’re in state 4 then after one flip you have a 0.5 chance of being in state 5 (with a heads), and 0.5 of returning to state 1 (with a tails).
- If you’re in state 5 then after one flip you have a 0.5 chance of being in state 6 (with a heads), and 0.5 of returning to state 1 (with a tails).
- If you’re in state 6 then after one flip you have a 0.5 chance of being in state 7 (with a heads), and 0.5 of returning to state 1 (with a tails).
- If you’re in state 7 then after one flip you have a 0.5 chance of being in state 8 (with a heads), and 0.5 of returning to state 1 (with a tails).
- If you’re in state 8 then you have achieved success, and will remain in state 8 with a probability of 1.0.
Putting all that in the form of the transition matrix T =
| 0.5 0.5 0.0 0.0 0.0 0.0 0.0 0.0 0.0 |
| 0.5 0.0 0.5 0.0 0.0 0.0 0.0 0.0 0.0 |
| 0.5 0.0 0.0 0.5 0.0 0.0 0.0 0.0 0.0 |
| 0.5 0.0 0.0 0.0 0.5 0.0 0.0 0.0 0.0 |
| 0.5 0.0 0.0 0.0 0.0 0.5 0.0 0.0 0.0 |
| 0.5 0.0 0.0 0.0 0.0 0.0 0.5 0.0 0.0 |
| 0.5 0.0 0.0 0.0 0.0 0.0 0.0 0.5 0.0 |
| 0.5 0.0 0.0 0.0 0.0 0.0 0.0 0.0 0.5 |
| 0.0 0.0 0.0 0.0 0.0 0.0 0.0 0.0 1.0 |
To get to the probability of each state after one flip...
(1) S1 = S0 × T
How about after two flips?
(2) S2 = S1 × T
Let’s substitute equation (1) in equation (2)...
(3) S2 = S0 × T × T = S0 × T2
What about after 3 flips?
(4) S3 = S2 × T
Substituting equation (3) into (4)...
(5) S3 = S0 × T2 × T = S0 × T3
We can keep doing this all the way to the state after the 100th flip...
S100 = S0 × T100
So, what is T100? Before computers it must have been a huge pain to figure such things out. However, with Excel’s MMULT function and a lot of copying and pasting we find T100 =
| 0.342616 0.171999 0.086347 0.043347 0.021761 0.010924 0.005484 0.317520 |
| 0.339863 0.170617 0.085653 0.042999 0.021586 0.010837 0.005440 0.323005 |
| 0.334379 0.167864 0.084271 0.042305 0.021238 0.010662 0.005352 0.333929 |
| 0.323454 0.162380 0.081517 0.040923 0.020544 0.010313 0.005178 0.355690 |
| 0.301693 0.151455 0.076033 0.038170 0.019162 0.009620 0.004829 0.399038 |
| 0.258346 0.129694 0.065109 0.032686 0.016409 0.008237 0.004135 0.485384 |
| 0.171999 0.086347 0.043347 0.021761 0.010924 0.005484 0.002753 0.657384 |
| 0.000000 0.000000 0.000000 0.000000 0.000000 0.000000 0.000000 1.000000 |
The term in the upper right shows us the probability of being in state 8 after 100 flips, which is 0.317520.
Have you heard the story of the Australian cricket player who called the toss of a coin incorrectly for 35 straight games, before getting the 36th call correct? What are the odds of that?
I had not heard of that until you mentioned it. You’re referring to the amazing story of a teenage cricket player for the Magpies Kristy Perrin, who indeed called the coin toss incorrectly 35 times in a row. The probability of getting exactly 35 or more incorrect is (1/2)35 = 1 in 34,359,738,368. To put that in perspective, the probability of hitting the Powerball is 1 in 195,249,054. That is 176 times more likely than missing 35 consecutive coin tosses.
Do you have any advice for betting on the flip of a coin?
Yes! Bet on the side face up in the flipper's hand. The academic paper Dynamical Bias in the Coin Toss by Persi Diaconis, Susan Holmes, and Richard Montgomery concludes that the coin will land on the same side it started on 51% of the time.
This question was raised and discussed in the forum of my companion site Wizard of Vegas.
On average, how many trials will it take in a 50/50 game to lose two in a row? How about 3, 4, n in a row?
Let's solve for the two loss case first.
Let x be the expected number of future flips starting from the beginning or after any win.
Let y be the expected number of future flips after one loss.
We can set up the following two equations:
(1) x = 1 + .5x + .5y
The one represents that the player must flip the coin to change states. There is a 50% chance of a win, remaining in state x. There is a 50% chance of a loss, advancing to state y.
(2) y = 1 + .5x
From state y again, the 1 represents the flip at that point. There is a 50% chance of a win, reverting to state x. There is a 50% chance of a loss, ending the game, necessitating no additional flips, so it is an implied 0.5*0.
Multiply both equations by 2 and reorder to get:
(3) x - y =2
(4) -x + 2y = 2
Add the two equations to get:
(5) y = 4
Plug that into any equation from (1) to (4) and get x=6.
For the three loss case, define the three possible states as:
Let x be the expected number of future flips starting from the beginning or after any win.
Let y be the expected number of future flips after one loss.
Let z be the expected number of future flips after two losses.
The initial equations are:
x = 1 + .5x + .5y
y = 1 + .5x + .5z
z = 1 + .5x
We can set up the initial states in matrix form as:
| 0.5 | -0.5 | 0 | 1 |
| -0.5 | 1 | -0.5 | 1 |
| -0.5 | 0 | 1 | 1 |
If you remember your matrix algebra, we can solve for x as determinant(A)/determinant(B) where
A =
| 1 | -0.5 | 0 |
| 1 | 1 | -0.5 |
| 1 | 0 | 1 |
B =
| 0.5 | -0.5 | 0 |
| -0.5 | 1 | -0.5 |
| -0.5 | 0 | 1 |
| 0.5 | -0.5 | 0 |
| -0.5 | 1 | -0.5 |
| -0.5 | 0 | 1 |
Excel has a handy determinant function: =mdeterm(range). In this case x = mdeterm(matrix A)/mdeterm(matrix B) = 1.75/0.125 = 14.
We can use recursion for additional consecutive losses. Let's consider 4. We know from above it will take 14 flips on average to get 3 losses in a row. At that point the coin will be flipped again, with a 50% chance of starting over. So:
x = 14 + 1 + x/2
x/2 = 15
x = 30
In other words, add one to the previous answer and then double.
It is not difficult to see the pattern. The expected number of flips to get n losses in a row is 2n+1-2.
This question was raised and discussed on my forum at Wizard of Vegas.
Given that a fair coin is tossed n times, what is the probability of seeing at least one streak of t tails?
The answer is 1-F(t)n+2/2n, where F(t)n is the n-th number in a t-step Fibonacci sequence.
What is a Fibonacci sequence, you might ask? The first number is a one. In a t-step sequence every subsequent number is the sum of the previous t numbers. Assume any number before the first number is zero.
Let's look at a two-step sequence. The first number is 1. The second is the sum of the previous two numbers. Assume a zero before the one, so the second number is 0+1=1. The third number is 1+1=2, the fourth is 1+2=3, the fifth is 2+3=5.
The first twelve 2-step Fibonacci numbers are: 1, 1, 2, 3, 5, 8, 13, 21, 34, 55, 89, 144.
Let's do an example. What is the probability of getting two consecutive tails at least once in ten flips?
We use the two-step Fibonacci sequence, because we need only two tails. The 12th number in the sequence (two more than the number of flips) is 144. So, the answer is 1-F(2)10+2/210 = 1 - 144/210 = 1 - 144/1024 = 85.94%.
How about the probability of getting five consecutive tails in the 20 flips?
The first 22 5-step Fibonacci numbers are 1, 1, 2, 4, 8, 16, 31, 61, 120, 236, 464, 912, 1793, 3525, 6930, 13624, 26784, 52656, 103519, 203513, 400096, 786568.
The answer is thus 1 - F(5)20+2/220 = 1 - 786,568/1,048,576 = 1 - 75.01% = 24.99%.
This question is discussed in my forum at Wizard of Vegas.
There is a biased coin with 60% chance of landing on heads. It is flipped until either there are two heads or two tails in a row. What is the chances two heads comes first?
Here is the answer and solution (PDF).
For discussion about this problem, please visit my forum at Wizard of Vegas.
Wizard, I challenge you to a bet. Here are the rules:
- You choose any pattern you like of heads (H) and tails (T). For example, HTT.
- After revealing your pattern, I will choose mine.
- We will flip a coin over and over until one pattern appears in order. The one who chose that pattern wins.
- I will give you 3 to 2 odds.
Do you accept? I will do it as many times as you wish.
No. Nice try though. The person acting second has a huge positional advantage. Here is the strategy for the person acting second and his probability of winning.
Odiusgambit Game Strategy
| Player 1 | Player 2 | Pr. Player 2 Wins |
|---|---|---|
| HHH | THH | 87.50% |
| HHT | THH | 75.00% |
| HTH | HHT | 66.67% |
| HHT | THH | 75.00% |
| THH | HTT | 75.00% |
| THT | TTH | 66.67% |
| TTH | HTT | 75.00% |
| TTT | HTT | 87.50% |
As the table above shows, my best chance to win, or your least, is if I pick either THT or HTH, where my chance of winning is still only 1 in 3. I should get 2 to 1 for it to be a fair bet, so getting only 3 to 2, you have a 16.67% edge.
Here is a way to remember the player two strategy. Let P(x) be the player 1's pick for position x. Let O(x) be the opposite of player 1's pick for position x. Player 2 should always pick: O(2) - P(1) - P(2).
This question is asked and discussed in my forum at Wizard of Vegas.
If you flip a fair coin 40 times, what is the probability of getting BOTH a streak of 5 heads and a streak of 5 tails? “A streak” meaning at least 1 and “5” meaning at least 5. The head and tail streaks do not have to be adjacent.
Please click the button below for the answer.
Here is my solution (PDF).
This question is asked and discussed in my forum at Wizard of Vegas.
Henry and Tom decide to bet on a coin flip. Henry wins on heads, Tom wins on tails.
It’s $1 per flip and they are really bored, so they decide to do one million flips. At the end of the session, the loser will write a check to the winner for the final balance. What is the expected value of the check amount?
The general formula for the answer is the sqrt(variance * (2/pi)).
The variance in this case is 1,000,000. So, the expected absolute difference between actual and expected results is sqrt(1,000,000 × (2/pi)) =~ 797.88456080286535587989211986876373695171726 232986931533185165934131585179860367700250466 781461387286060511772527036537102198390911167 448599242546125101541269054116544099863512903 269161506119450728546416733918695654340599837 28381269120656178667772134093073.
I ask a related question in Ask the Wizard #358, which will help show where I get the sqrt(2/pi) term.
This question was asked and discussed in forum at Wizard of Vegas.
Suppose a casino has a game based on a fair coin flip that pays even money. A player wishes to play one million times at $1 a bet. How much money should he bring to the table to have a 50% chance of not going broke?
Let's first answer the question of what is the probability the player will be down more than x units after one million flips, assuming the player has an unlimited bankroll.
Since this is a fair bet, the mean win after a million flips is zero. The variance of each flip is 1, so the variance of one million flips is one million. One standard deviation is thus sqrt(1,000,000) = 1000.
We can find the bankroll required with the Excel function =norm.inv(probability,mean,standard deviation). For example, if we put in =norm.inv(.25,0,1000), we get -674.49. This means if after one million flips, the player has a 25% chance of being down 674 or more. Please keep in mind this is an estimate. To get a true answer, we should use the binomial distribution, which would be very tedious with a million flips.
It could very well happen that if the player took $674 to the table, he might run out of money before the million flips. If he could keep playing on credit, it might happen that he has a recovery and finishes less than $674 down. In fact, once the player is at -674, there is a 50/50 chance he will end up above or below -674 at any given point in the future.
So, if the player can play on credit, there are three possible outcomes.
- Player never falls below -674.
- Player falls below -674 at some point, but recovers and finishes above -674.
- Player falls below -674 at some point, keeps playing and loses even more.
We have established scenario 3 has a probability of 25%.
Scenario 2 must have the same probability as scenario 3, because once the player is down -674, he has a 50/50 chance to finish above or below that point after one million flips.
Scenario 1 is the only other alternative, which must have probability 100%-25%-25% = 50%.
If the probability the player never falls below 674 is 50%, then the alternative of falling below must be 100%-50% = 50%.
So, there is our answer to the original question, $674.
This question is asked and discussed in my forum at Wizard of Vegas.